
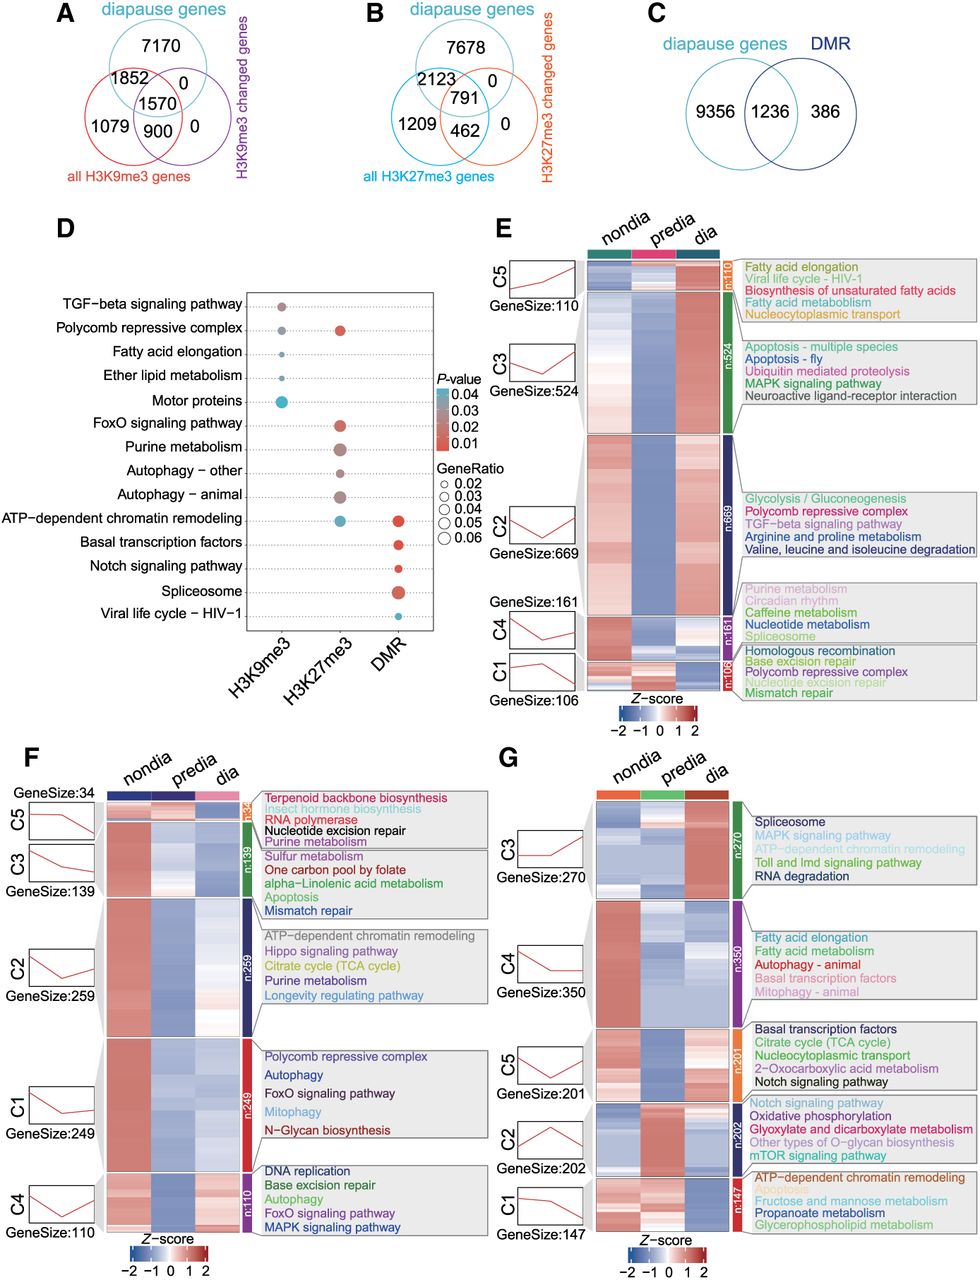
Clustering of the epigenetically modified genes known to be important for diapause regulation. (A–C) The Venn diagram illustrates the number of overlapping genes between the known diapause-regulating gene number and the gene numbers epigenetically modified by H3K9me3 (A), H3K27me3 (B), and DNA methylation (C), with or without changes during diapause, respectively. (D) Comparative KEGG enrichment analysis of the overlapping genes shown in panels A–C for H3K9me3, H3K27me3, and DNA methylation, respectively. (E–G) Clustering of the overlapping genes shown in panels A–C for H3K9me3 (E), H3K27me3 (F), and DNA methylation (G), respectively. Heatmaps show the genes with statistically significant changes (clustered by k-means). The line displays the overall changes in genes in each cluster (left). The KEGG enrichment of genes of clusters is shown on the right panel.


