
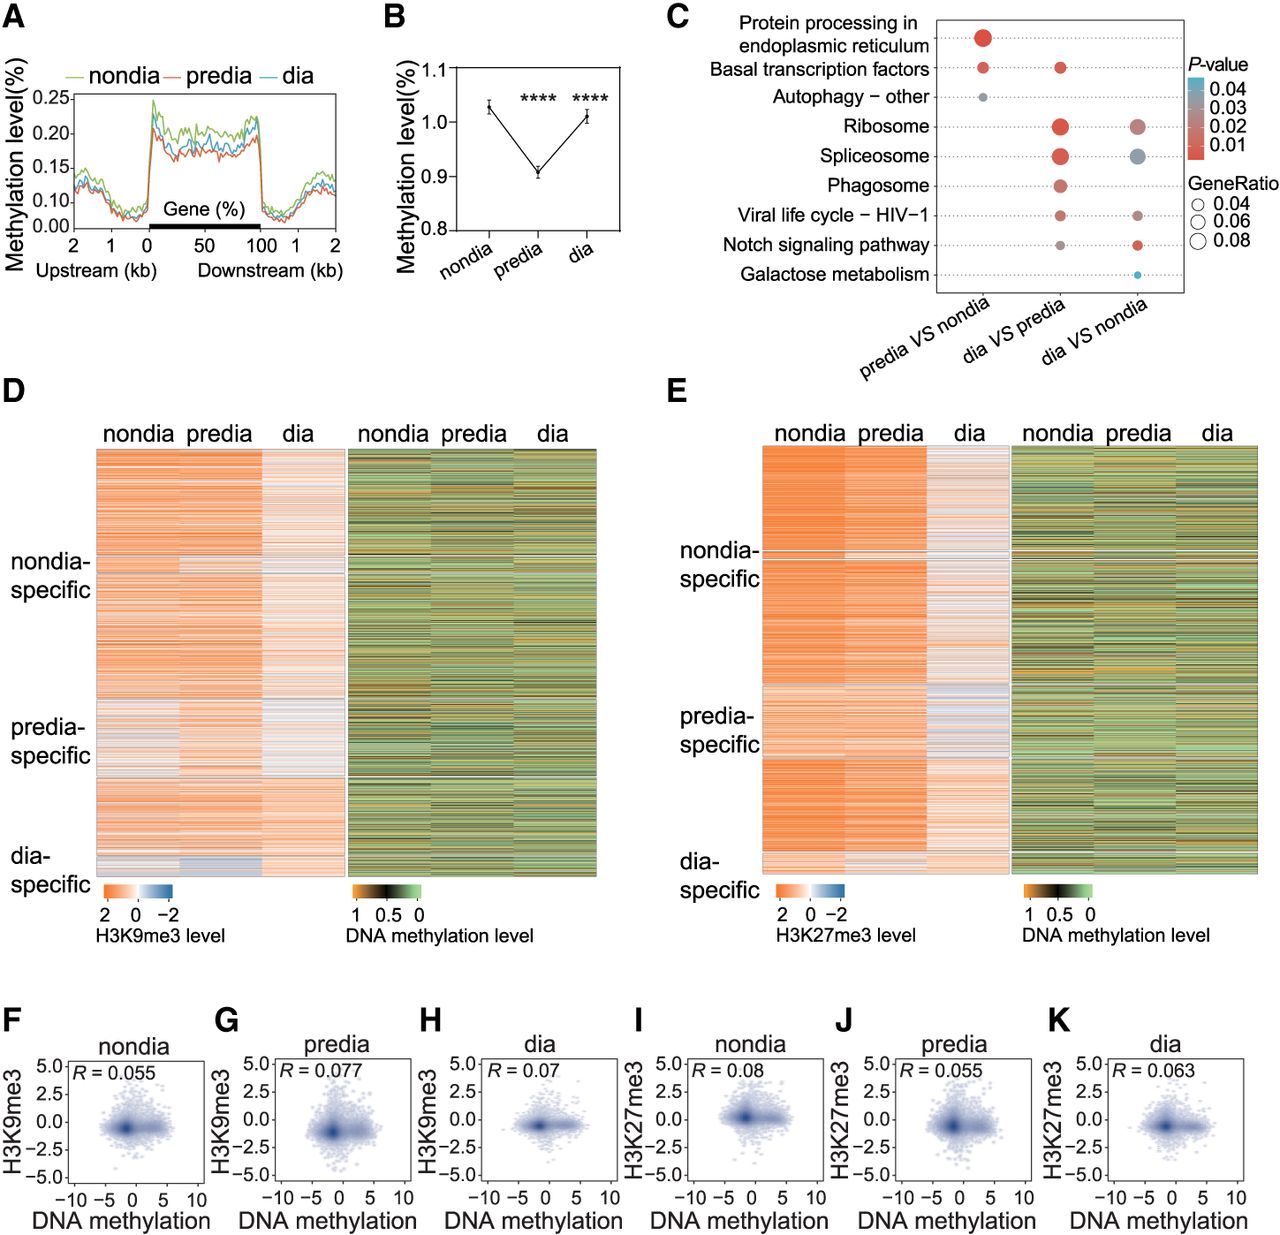
WGBS analysis reveals significant changes in DNA methylation during the diapause stages of Asian corn borer larvae but are not correlated with H3K9me3 and H3K27me3 in occupation. (A) Metaplot showing variations in DNA methylation levels upstream of and downstream from gene bodies at different developmental stages. Each region of the gene was equally divided into 50 bins, and the methylation level was defined as the average of the methylated cytosines of the bins. (B) The average levels of DNA methylation in the nondiapause, prediapause, and diapause stages displayed in a line chart showed significant changes during diapause stages. Each data point represents the mean ± SEM of the methylation level (percentage of methylated CG in all CGs) for each diapause stage. (****) P < 0.0001 (determined by unpaired t-test). (C) Comparative KEGG enrichment analysis of genes with significant changes in DNA methylation during different diapause stages. (D) Heatmaps showing the dynamics of H3K9me3 (left) and DNA methylation (right) on H3K9me3-positive genes during diapause of Asian corn borer larvae. (E) Heatmaps showing the dynamics of H3K27me3 (left) and DNA methylation (right) on H3K27me3-positive genes during diapause of Asian corn borer larvae. (F–H) Genome-wide correlation plots depicting the association between H3K9me3 and DNA methylation occupancies at the nondiapause, prediapause, and diapause stages. (I–K) Genome-wide correlation plots depicting the association between H3K27me3 and DNA methylation occupancies at the nondiapause, prediapause, and diapause stages.


