
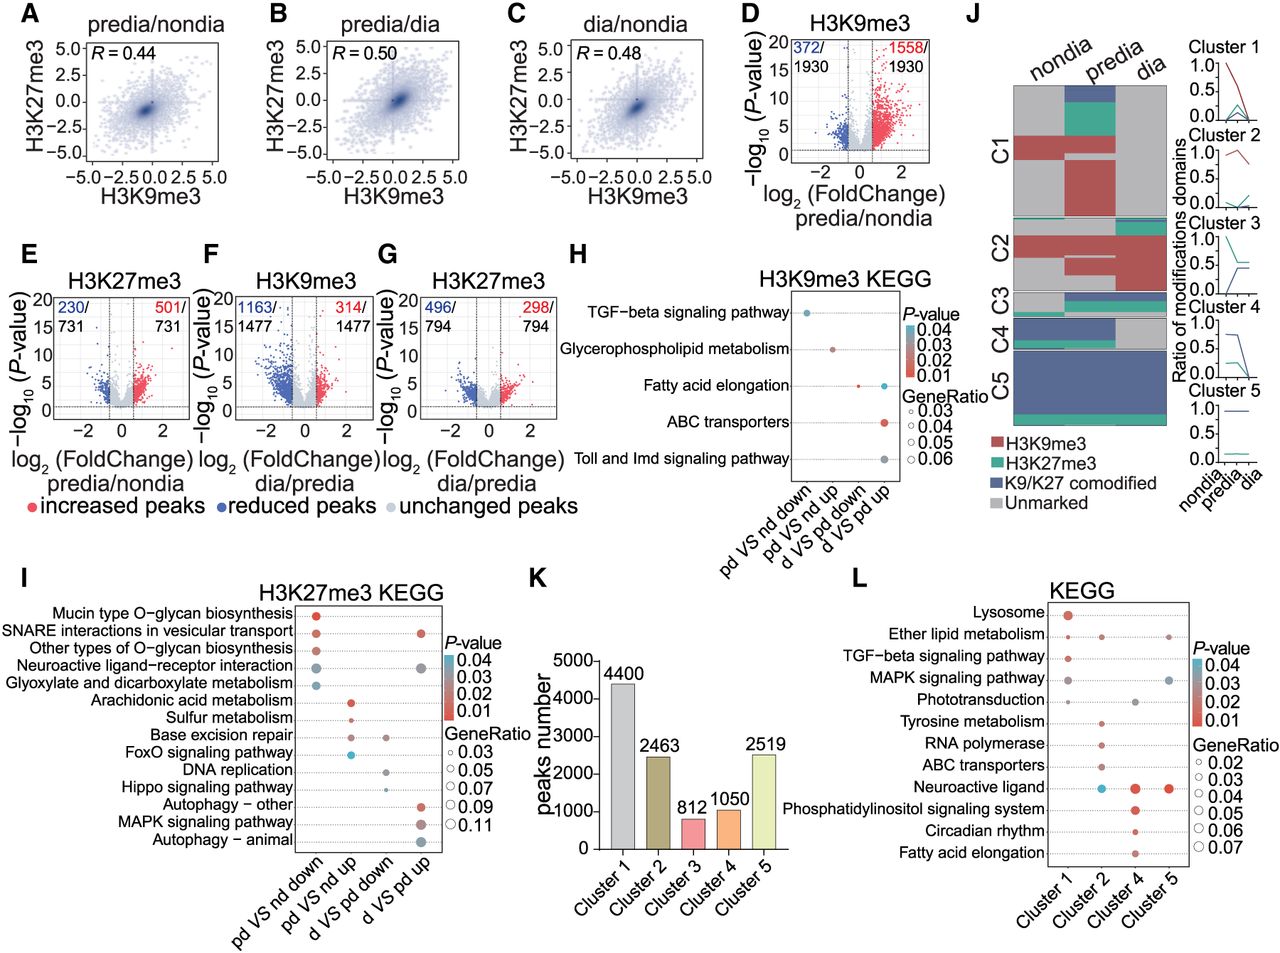
Global features of H3K9me3 and H3K27me3 modifications during diapause of Asian corn borer larvae. (A) Genome-wide correlation plots of H3K9me3 and H3K27me3 occupancies changed between the prediapause and nondiapause stages, respectively. (B) Genome-wide correlation plots of H3K9me3 and H3K27me3 occupancies changed between the prediapause and diapause stages, respectively. (C) Genome-wide correlation plots of H3K9me3 and H3K27me3 occupancies changed between the diapause and nondiapause stages, respectively. (D–G) Volcano plot of genes with statistically significant differential H3K9me3 and H3K27me3 peaks between different diapause stages. (H) Comparative KEGG enrichment analysis of genes with statistically significant differential H3K9me3 peaks. (I) Comparative KEGG enrichment analysis of genes with statistically significant differential H3K27me3 peaks. (J) Heatmaps showing the clustering of genes with H3K9me3, H3K27me3, or H3K9me3/H3K27me3 comodifications in the nondiapause, prediapause, and diapause stages (left panel). The ratios of H3K9me3, H3K27me3, and H3K9me3/H3K27me3 comodified genes are shown (right panel). Red indicates the domains that are marked only by H3K9me3; green, domains that are marked only by H3K27me3; blue, H3K9me3/H3K27me3 comodified domains; and gray, unmarked domains. (K) The number of peaks in each cluster in panel J. (L) Comparative KEGG enrichment analysis of genes in different clusters in panel J.


