
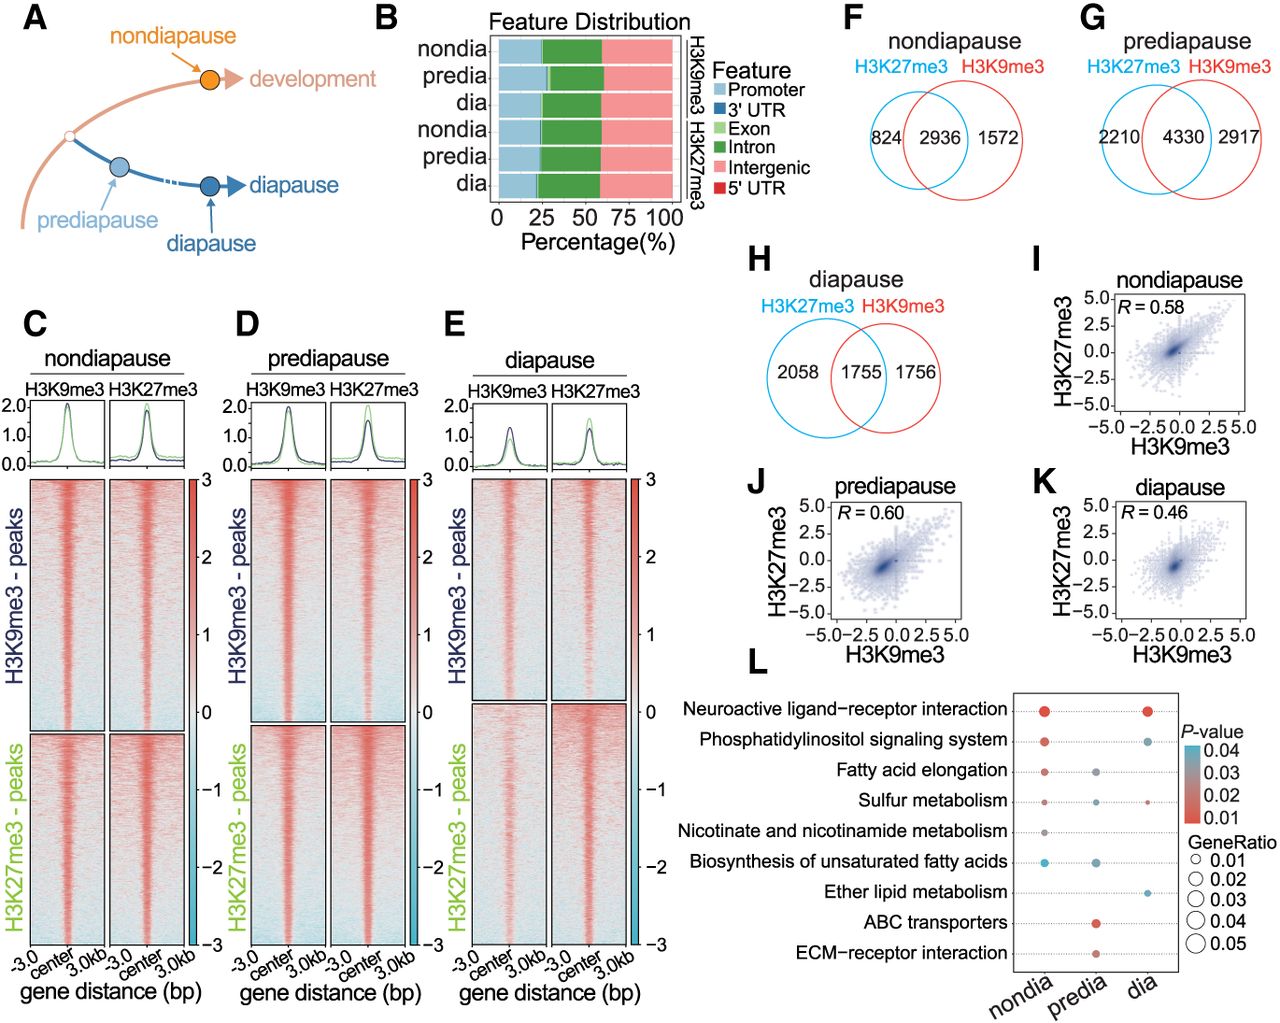
Positive correlation between H3K9me3 and H3K27me3 during different diapause stages. (A) ChIP-seq experimental design. (B) Distribution of H3K9me3 and H3K27me3 peaks across the annotated genome. (C–E) Overlapping peaks of H3K9me3 and H3K27me3 in the nondiapause (C), prediapause (D), and diapause (E) stages. (F–H) Venn diagram shows the number of genes with H3K9me3 peaks, H3K27me3 peaks, or both at the nondiapause (F), prediapause (G), and diapause (H) stages. (I–K) Genome-wide correlation plots showing correlation of the occupancies of H3K9me3 and H3K27me3 at the nondiapause (I), prediapause (J), and diapause (K) stages. The correlation coefficient R is indicated. (L) Comparative KEGG enrichment analysis of comodified genes in the nondiapause, prediapause, and diapause stages. The color shade of the dots represents the P-value, and the size of the dots represents the gene enrichment ratio.


