
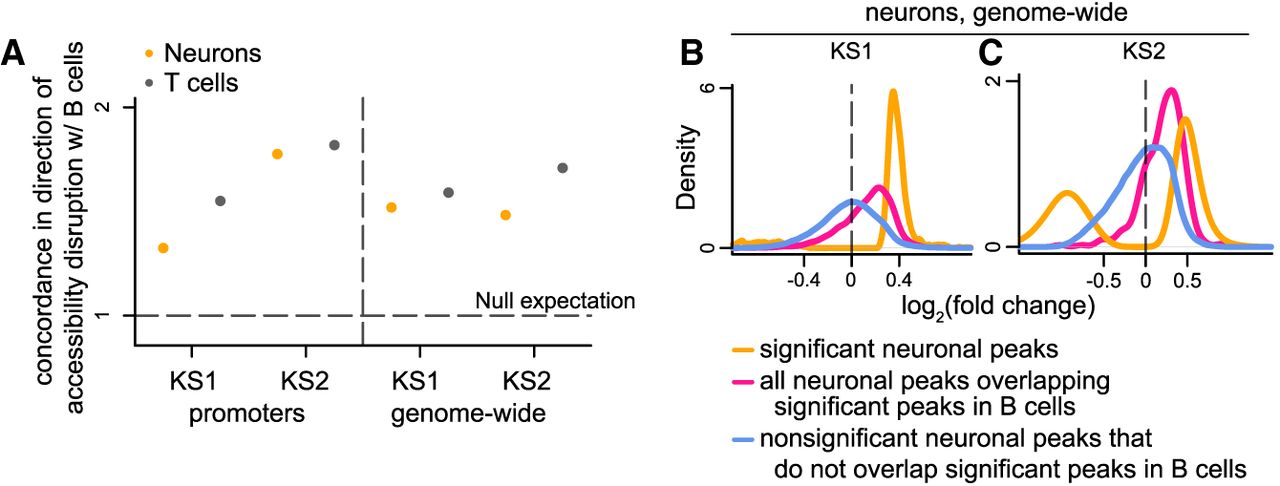
Evaluating whether chromatin accessibility changes occur toward the same direction in neurons, B cells, and T cells in KS types 1 and 2. (A) The ratio (y-axis) of the proportion of ATAC peaks that overlap differentially accessible B cell peaks and show accessibility changes in the same direction in neurons (orange dots) or T cells (black dots), over the average proportion of ATAC peaks that overlap randomly sampled B cell ATAC peaks and show accessibility changes in the same direction in neurons or T cells. The dashed horizontal line corresponds to the null expectation when there is no significant concordance in the direction of the accessibility disruption (sign of log 2 (fold change)) between the two cell types tested. (B,C) The distribution of neuronal effect sizes (log2 (fold changes)), shown for the significant disrupted neuronal ATAC peaks (orange), significantly disrupted neuronal peaks overlapping significantly disrupted B cell peaks (pink), and other neuronal peaks (blue). Significance is defined as Q-value < 0.1.


