
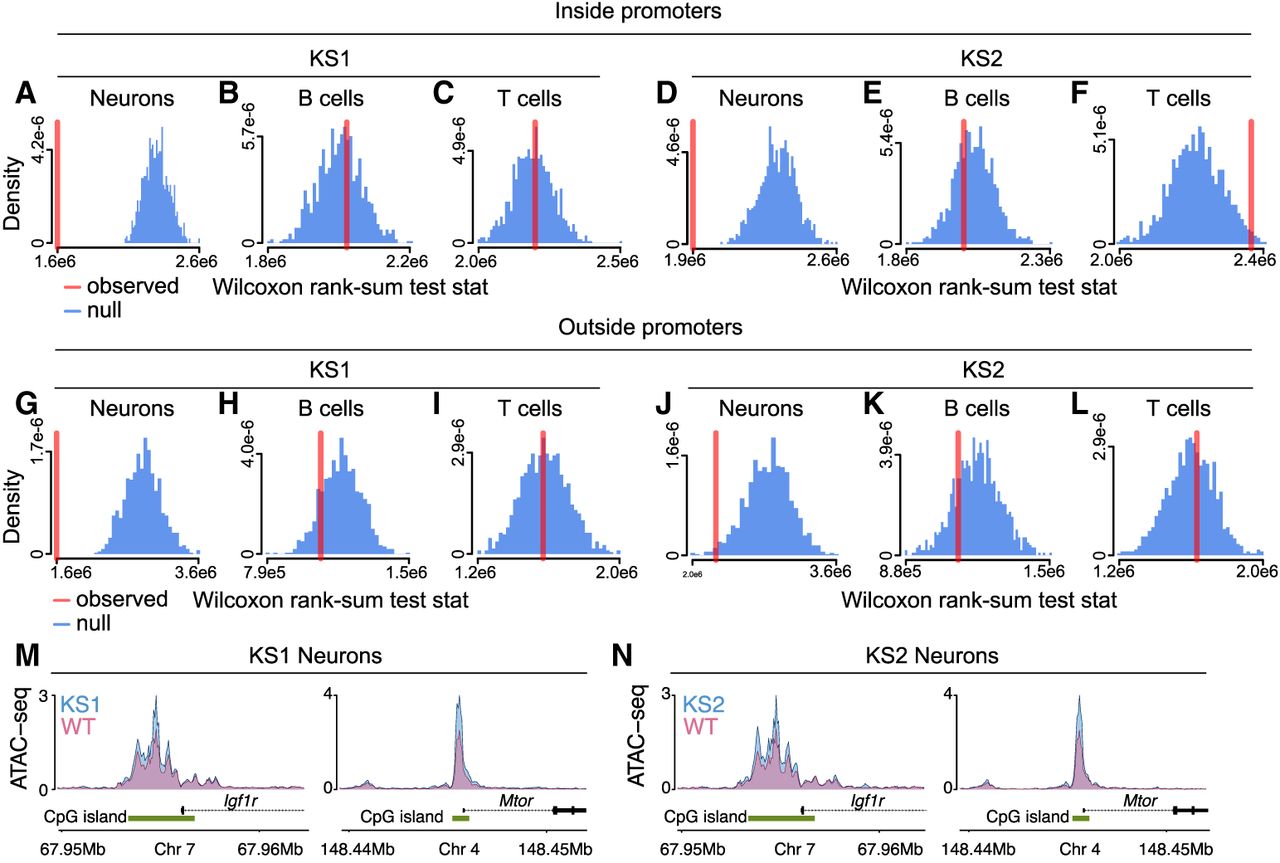
Investigating the chromatin disruption of aging-related regulatory elements in neurons, B cells, and T cells in KS types 1 and 2. (A–L) The observed value (red vertical line) of the Wilcoxon rank-sum test statistic obtained after comparing the differential accessibility P-values of aging-related ATAC peaks (i.e., ATAC peaks that contain epigenetic clock CpGs) to the differential accessibility P-values of other ATAC peaks. Observed values that are lower than expected under the null (blue distributions) indicate the collective disruption of aging-related peaks. Shown separately for neurons, B cells, and T cells, in KS1 and KS2, for ATAC peaks overlapping promoters and ATAC peaks outside promoters. The null distributions were derived by repeatedly (1000 times) sampling random sets of peaks and calculating the Wilcoxon rank-sum test statistic after comparing the P-values of these randomly sampled peaks to the P-values of all other peaks. Each random set contained an equal number of peaks to the number of aging-related peaks. (M,N) The normalized ATAC signal of Igf1r and Mtor, two genes known to regulate lifespan-related pathways, in mutant and wild-type neurons. Shown for KS1 and KS2.


