
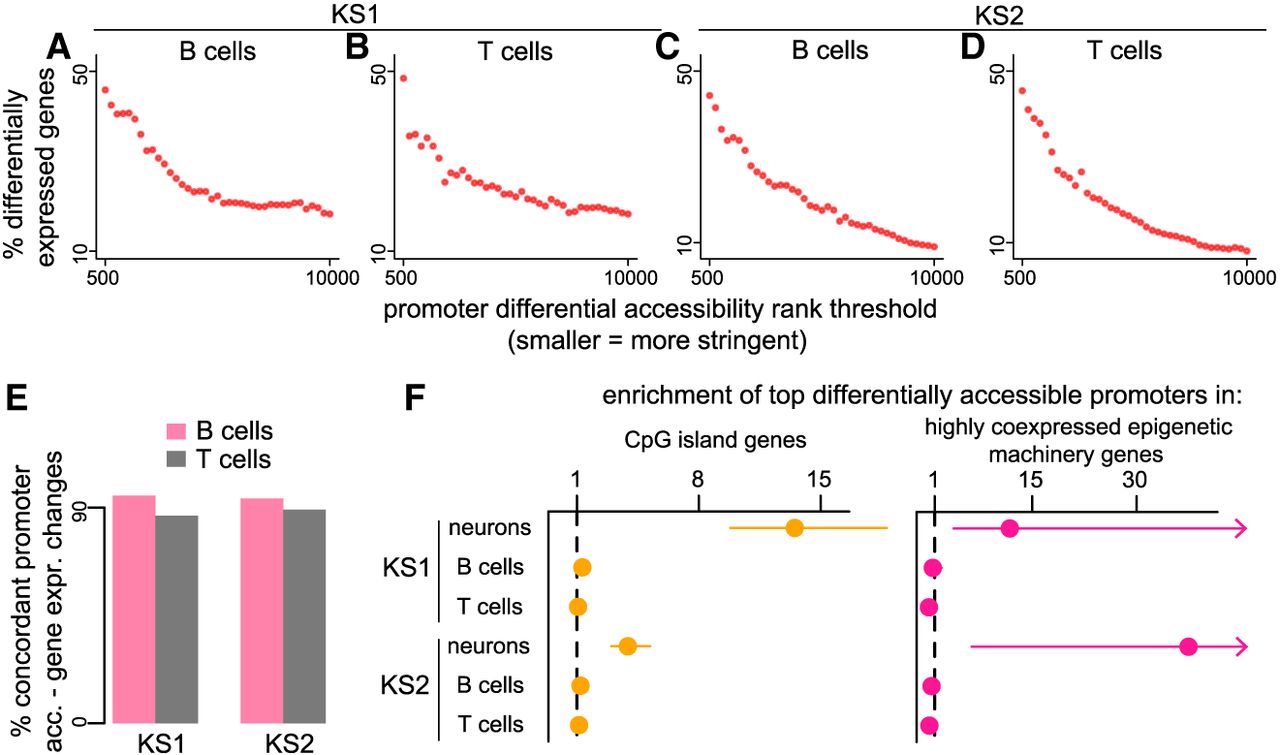
Investigating the relationship between promoter chromatin accessibility disruption and gene expression dysregulation. (A–D) Each point corresponds to a rank threshold for promoter differential accessibility and depicts the proportion (y-axis) of differentially expressed genes among genes whose promoter differential accessibility P-value is ranked below that threshold (see also Methods). For example, the first point from the left in each plot corresponds to the proportion of differentially expressed genes among genes with a promoter differential accessibility P-value among the smallest 500 P-values. Thresholds are calculated sequentially, with a step size of 250; smaller is equivalent to more stringent. (E) The proportion of disrupted promoter–gene pairs with concordant disruption. Concordance is defined as either increased accessibility–increased expression or decreased accessibility–decreased expression. (F) The enrichment (odds ratio) of the top-ranked genes (based on promoter differential accessibility) in the group of genes with CpG island promoters or in highly coexpressed epigenetic machinery genes. The enrichment is calculated by comparing against the bottom-ranked genes (see also Methods). The horizontal dashed line at one corresponds to no enrichment. The 95% confidence intervals are depicted for cases with enrichment exceeding one. Upper CI bound for the enrichment of the top-ranked genes in highly coexpressed epigenetic machinery genes in KS1 and KS2 = 60.01 and 1508.9, respectively.


