
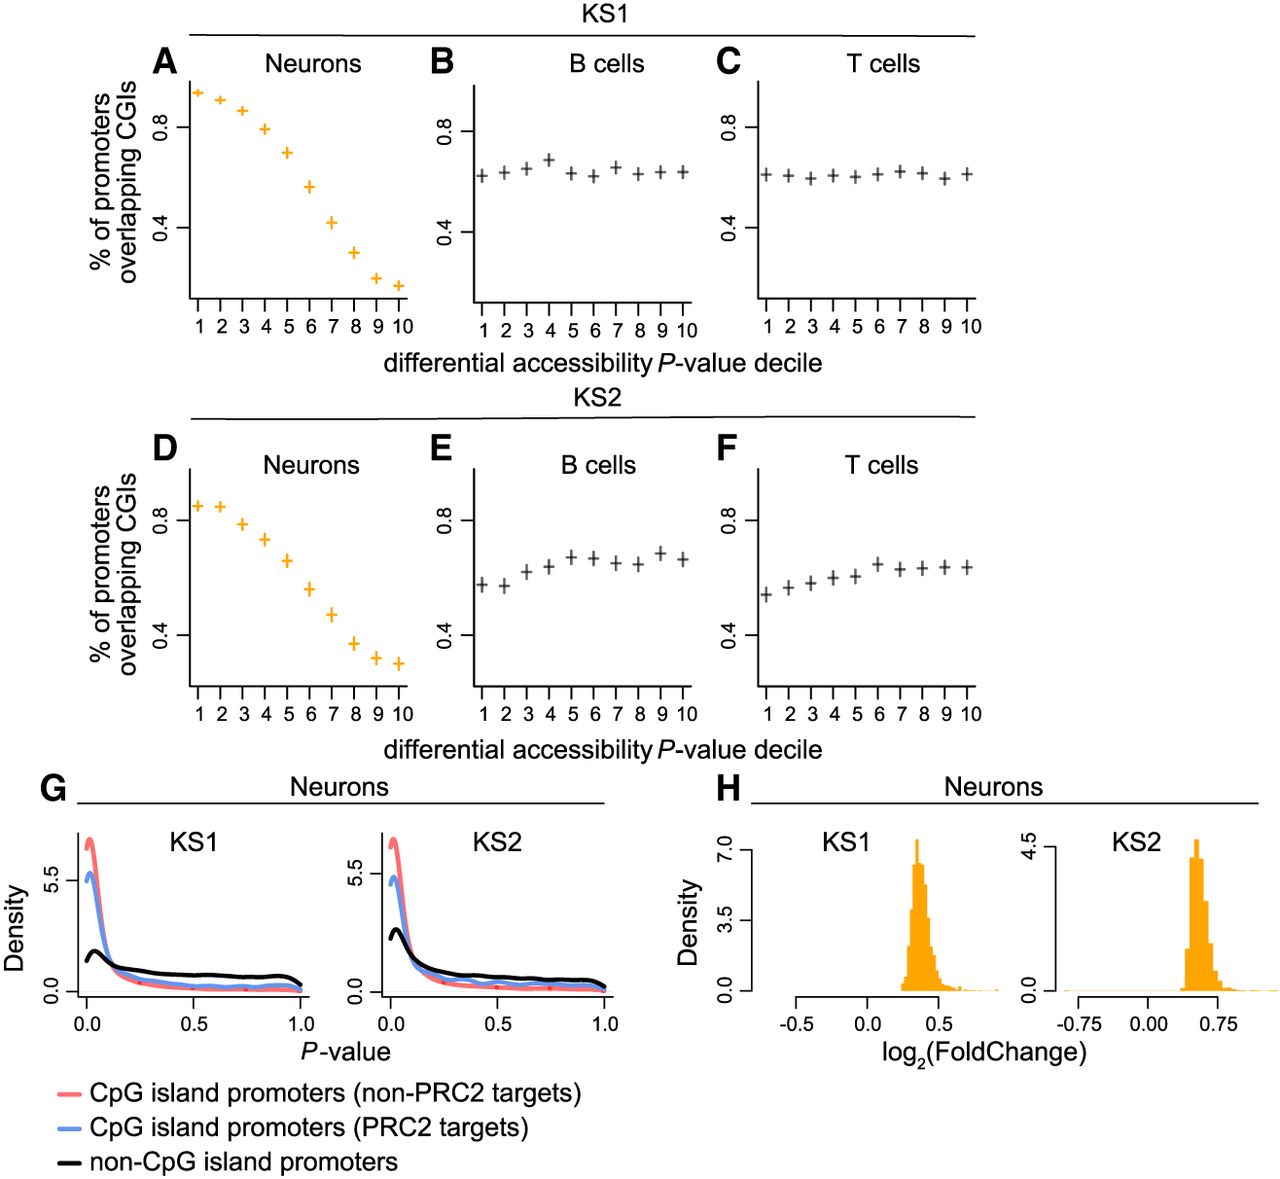
Assessing the relationship between promoter chromatin accessibility disruption and promoter CpG-richness in neurons, B cells, and T cells in KS1 and KS2. (A–F) The proportion of promoter ATAC peaks overlapping CpG islands, stratified according to P-value decile. The horizontal lines of the crosses correspond to these proportions across the deciles, and the vertical lines of the crosses depict the associated 95% binomial confidence intervals. Shown separately for neurons, B cells, and T cells in KS1 (first row) and KS2 (second row). The P-values for these promoter peaks are derived from the corresponding differential accessibility analyses (Methods). (G) The P-value distributions of promoter peaks, stratified according to whether these peaks overlap CpG islands targeted by Polycomb Repressive Complex 2 (blue densities), overlap other CpG islands (red densities), or are located outside CpG islands (black densities). Shown for KS1 and KS2 neurons. (H) The distribution of the magnitude of accessibility changes (log2(fold change)) of the most disrupted CpG island–overlapping promoter peaks (bottom 10% P-value) in KS1 and KS2 neurons.


