
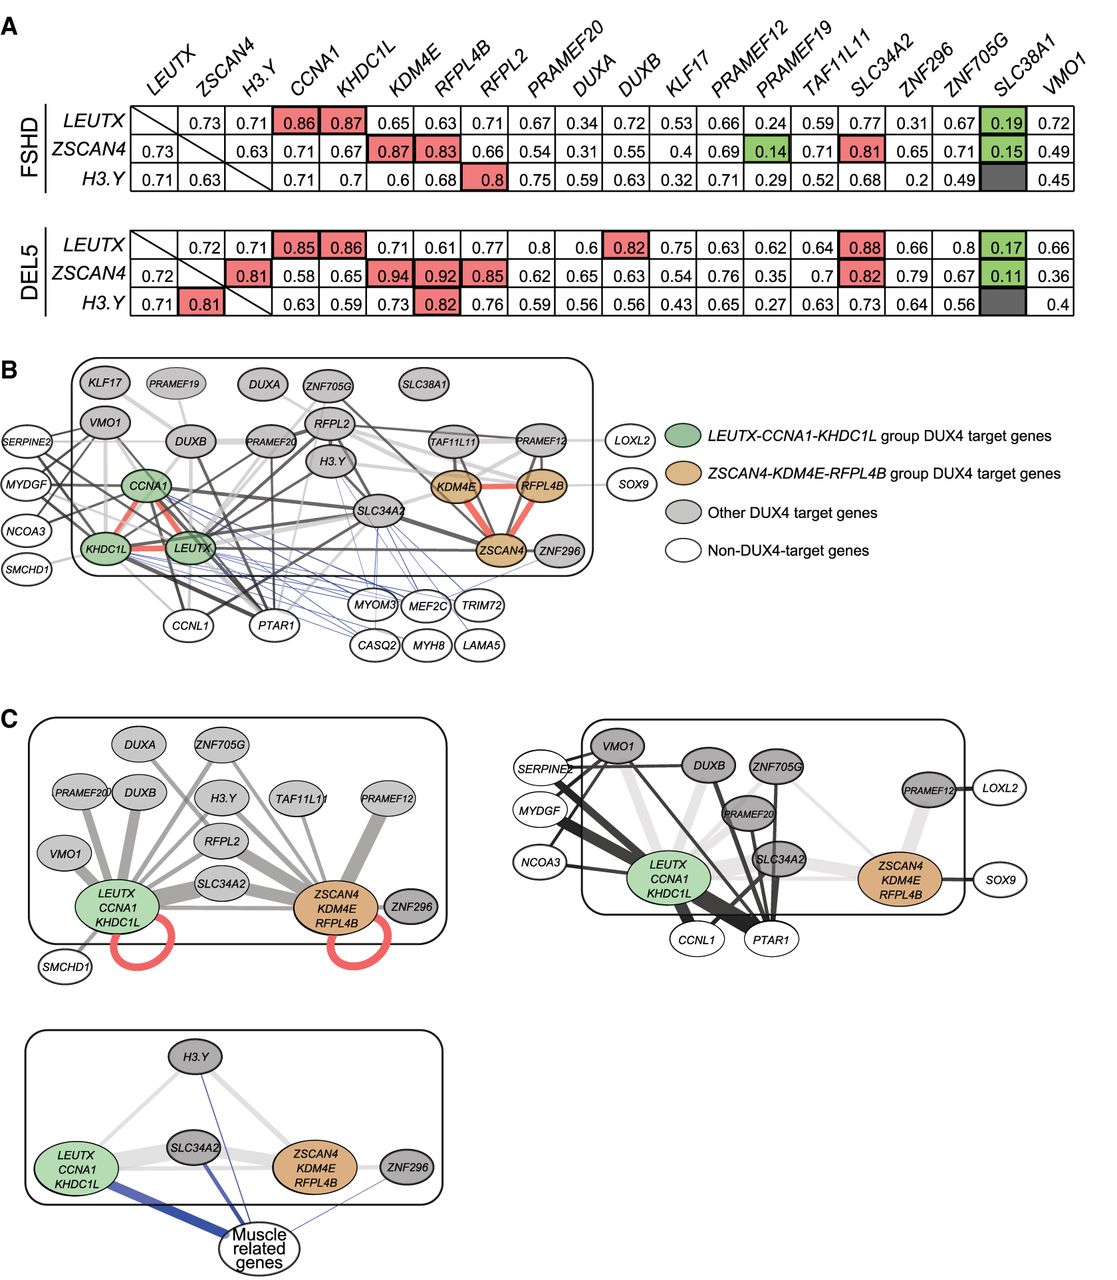
Differential correlation between DUX4 target genes in FSHD and DEL5 myotubes reveals network hubs showing differential association with non-DUX4 targets. (A) Pearson correlation analysis of DUX4 target genes in FSHD and DEL5 myotubes. Correlation between genes is determined by normalized and batch-corrected expression values of three DUX4 target genes versus all 20 DUX4 target genes. The top panel shows data for FSHD myotubes, and the bottom panel shows data for DEL5 myotubes. Some specific results are highlighted, with red indicating a very strong positive relationship, green indicating a very weak relationship, and gray indicating a P-value > 0.05. (B) The expression values of 20 DUX4 target genes (enclosed in the block box) and 14 non-DUX4-target genes in FSHD and DEL5 myotubes are analyzed by WGCNA. Red edges indicate gene pairs that show strong coexpression in both cell lines, with weights greater than 0.4 and mean values exceeding 0.5. Dark gray and light gray edges represent positive correlations between genes that do not meet the threshold of the red edges. Dark gray edges indicate that the correlation values between FSHD and DEL5 are not significantly different. Blue edges indicate negative correlations between genes. The thickness of each edge represents the average absolute weight of the corresponding gene pair in both cell lines. For the correlations between DUX4 target genes, only weights greater than 0.2 are displayed, except for DUXA, ZNF296, and PRAMEF19. These three DUX4 target genes have a lower threshold of 0.06 and are presented with their largest mean weight. For the correlations between DUX4 target genes and non-DUX4-target genes, the network represents positive correlations with weights above 0.06 or negative correlations above 0.025 in both cell lines. The correlations between non-DUX4-target genes are not shown. (C) Three subfigures extracted from B. The LEUTX-CCNA1-KHDC1L groups, ZSCAN4-KDM4E-RFPL4B groups, and six genes related to muscle function or development are classified into three groups, respectively, with the width of the edges proportional to the sum of the weights of the edges between two individual genes in B. To highlight the differences in edge weights, the scale used in these subfigures differs from that of B. The red self-loop is not scaled in the same manner as the other edges. In the top left panel, the two DUX4 target gene groups and other DUX4 target genes connected to them are displayed. SMCHD1 and DUXA are also included in this panel. The top right panel presents seven non-DUX4-target genes along with the DUX4 target genes/groups they are connected to by dark edges. The bottom left panel displays all three gene groups and shows the DUX4 target genes that are negatively correlated with the muscle genes group. The connections between DUX4 target individual genes and the groups and in top right and bottom left panels are represented by very light edges. For all three panels, the edges between individual DUX4 target genes are not shown, except for DUXA in the top left panel.


