
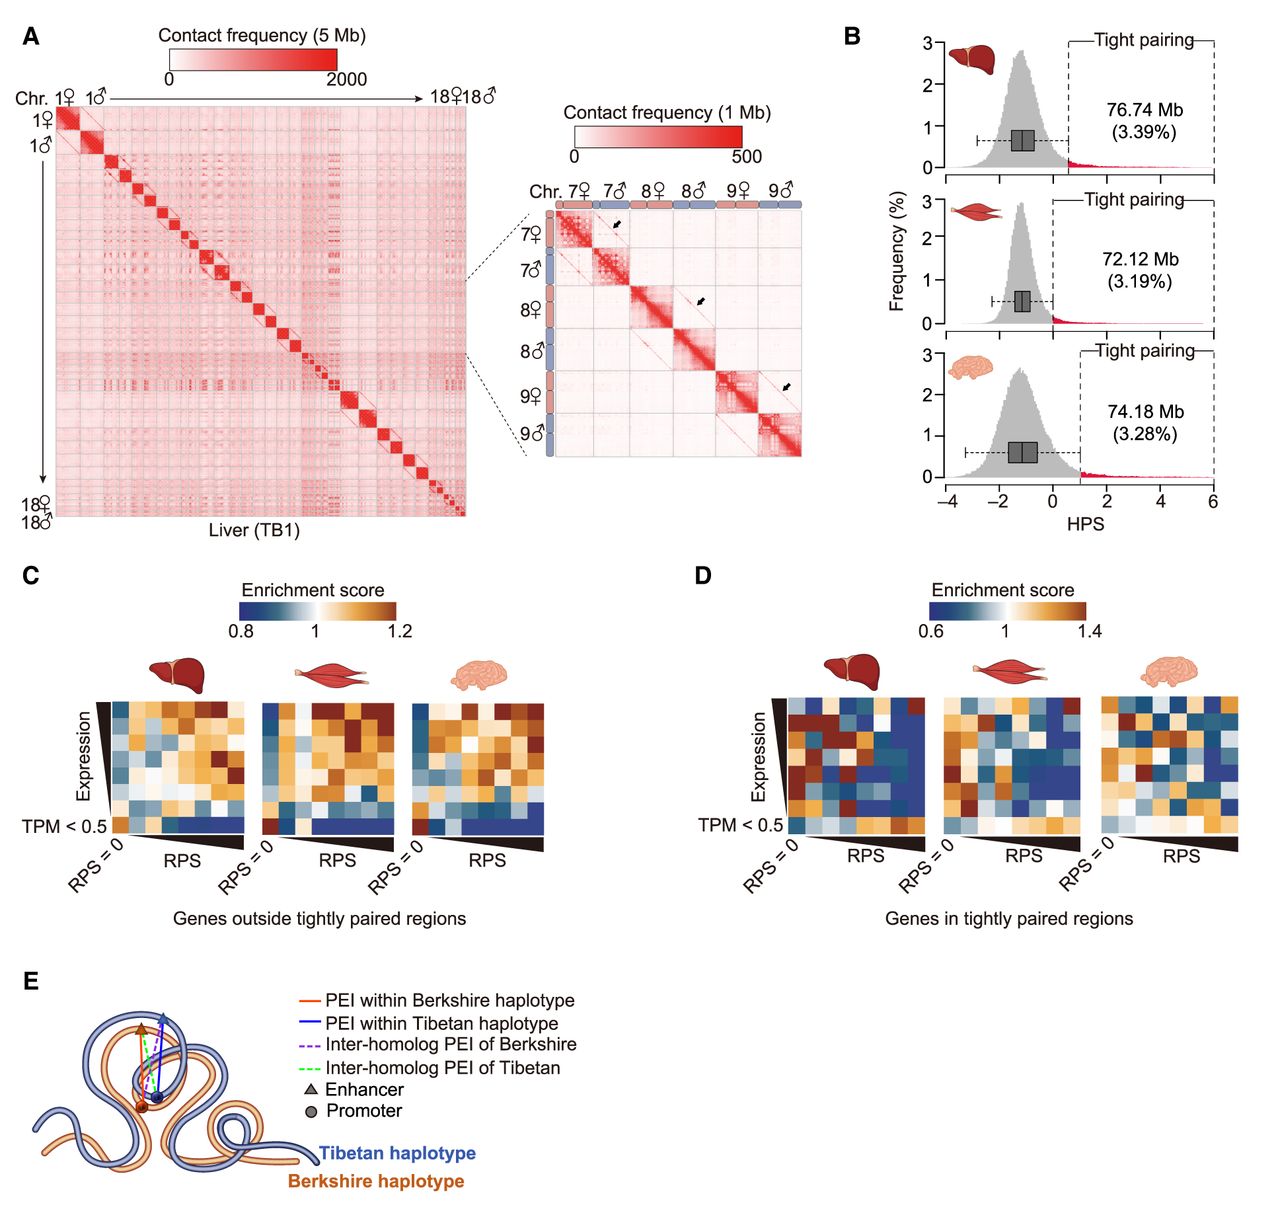
Highly structured homolog pairing in F1 hybrids. (A) Hi-C maps showing signals of genome-wide homolog pairing (arrows) in representative somatic tissue (liver) of a hybrid pig. Magnified Hi-C maps of Chromosomes 7, 8, and 9 are shown on the right. (B) Identification of tightly paired loci in all three somatic tissues of hybrid pig based on distribution of homolog pairing score (HPS) values. In the boxplot, the internal line indicates the median; the box limits indicate the 25th and 75th quartiles; and the whiskers extend to 1.5 × IQR from the quartiles. Rare tightly paired loci (liver, 76.74 Mb; muscle, 72.12 Mb; brain, 74.18 Mb) are defined as those with a HPS above Q3 + 1.5 × IQR. (C,D) Enrichment of RPSs (x-axis) from gene expression (y-axis) indicates the increased covariations between allelic expression and intra-chromosomal-based RPSs (i.e., genes with a larger RPS had higher expression) for genes outside the tightly paired regions (C) compared with genes located in the tightly paired regions (D). (E) Schematic representation of intra-chromosomal (solid lines) and inter-homolog (dashed lines) promoter–enhancer interactions in tightly paired loci; the formers are generally much stronger than the latter.


