
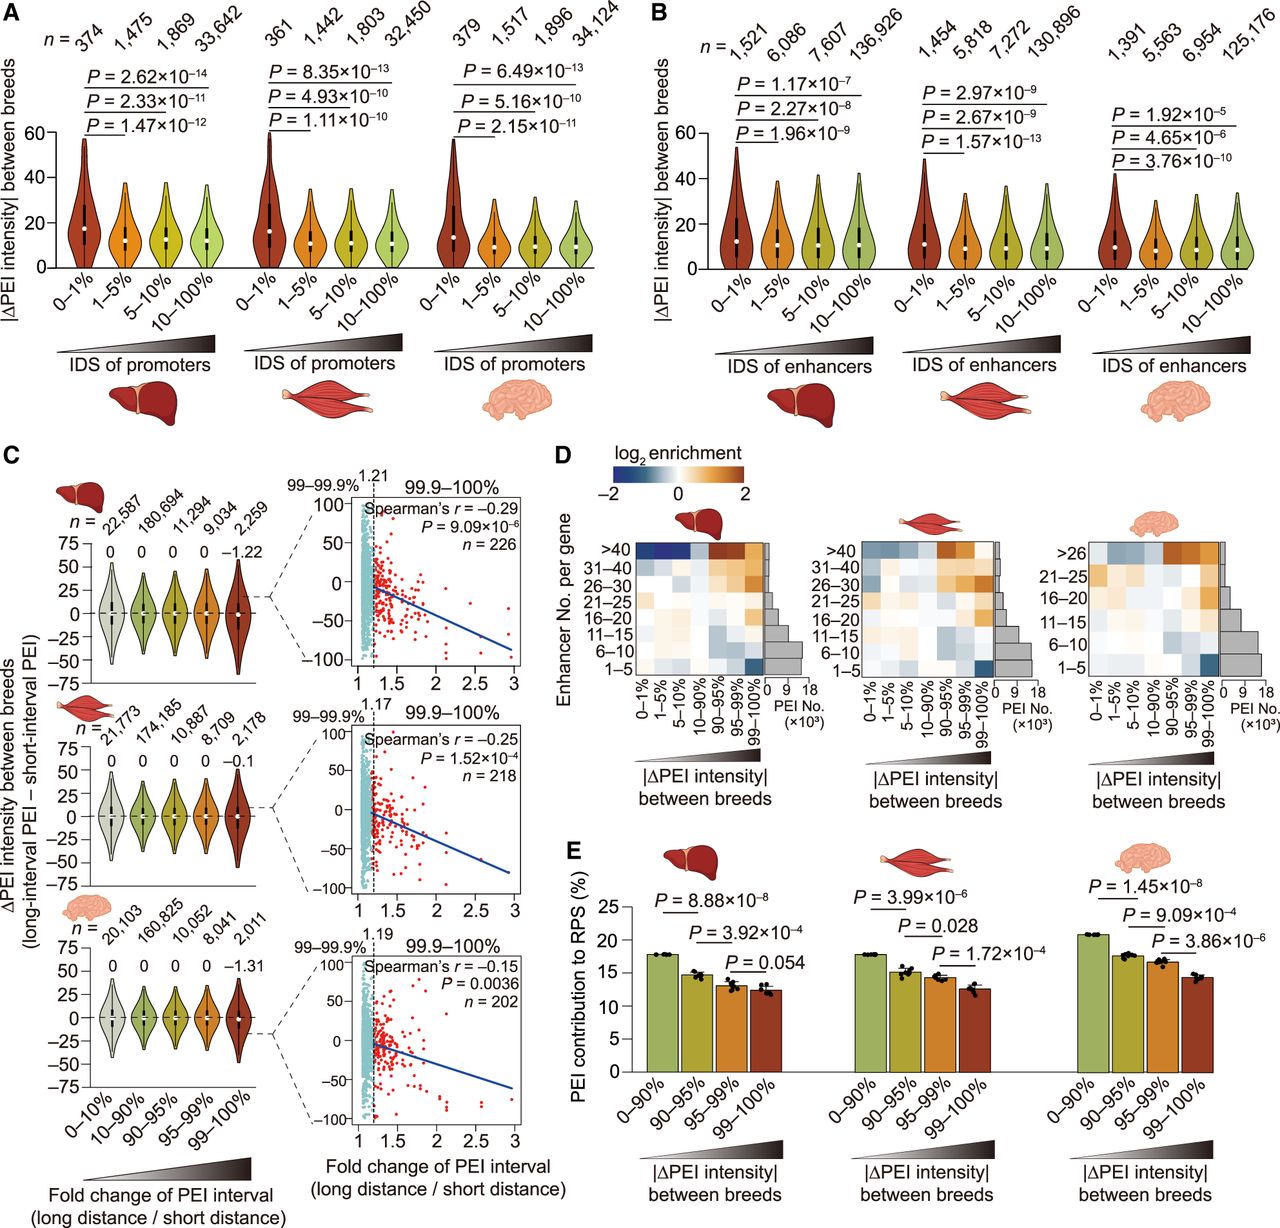
Influence of allelic sequence variations on PEIs. (A,B) Promoters (A) and enhancers (B), with higher allelic sequence divergence (especially those with the lowest 1% of IDS between parental breeds) (see Supplemental Methods), showed greater differences in PEI intensity. P-values are from a Wilcoxon rank-sum test. (C) Effects on PEI intensity caused by allelic variation-induced differences in PEI bridging distances. PEIs with the top 1% of increases in bridging distance showed significantly decreased PEI intensity (0%–99% vs. 99%–100%: P = 5.03 × 10⁻¹² in liver, P = 2.21 × 10⁻⁶ in muscle, and P = 3.26 × 10⁻¹⁰ in brain; Wilcoxon rank-sum test; left). This trend is more prominent in PEIs with the greatest extension (allelic fold change in linear bridging distance of the top 0.1%: 1.17–1.21), which showed strongly negative correlations between bridging distance and PEI intensity of PEIs (Spearman's r = –0.15 to –0.29, P ≤ 0.0036; right). (D) PEIs with enrichment for differential allelic intensity (x-axis) among genes that contact a variable number of enhancers (y-axis) in the three tissues. (E) PEIs showing greater differential allelic intensity tend to contribute less to RPS (including the combined regulatory effects of multiple enhancers for a given gene) and thus exert the least impact on gene expression. P-values are from a paired Student's t-test. Hi-C maps at 5-kb resolution were used to generate these graphs.


