
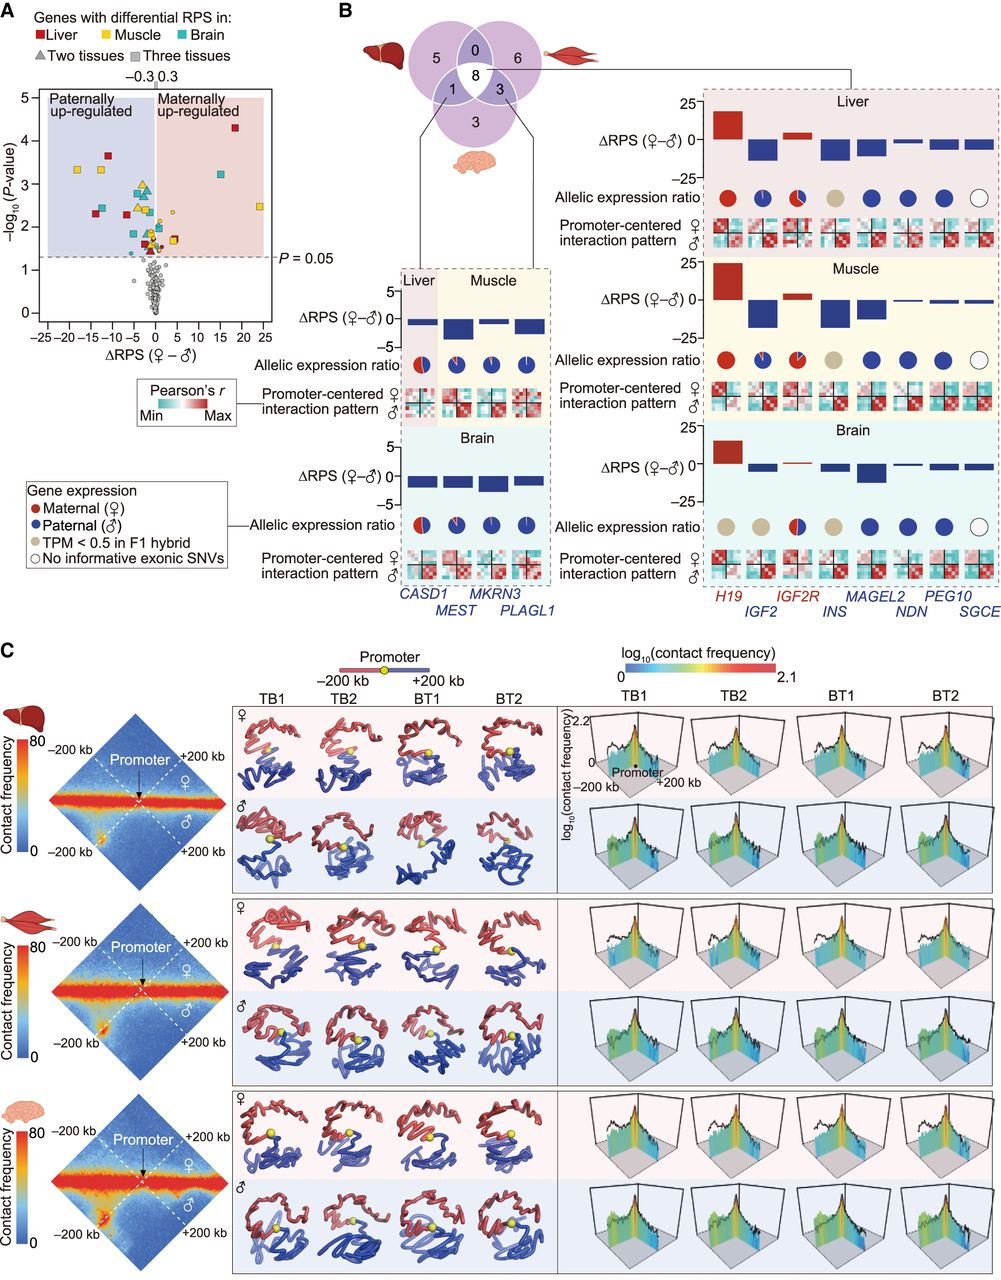
Parent-of-origin-specific PEI organization of imprinted genes. (A) Quantification of PEIs in 126 previously described imprinted genes identified 101 genes with informative SNVs that interacted with enhancers in at least one tissue. Plots of differential RPSs between parents of origin in at least two tissues are shown for 12 representative imprinted genes (|ΔRPS| > 0.3 and P < 0.05, paired Student's t-test). (B) Allelic differences in RPS and expression of 12 imprinted genes with differential RPS listed in A. The similarity (Pearson's r) of interactions in promoter-centered regions (200 kb upstream of and downstream from the promoter bin) among eight haplotypes is shown for each tissue. (C) Allelic promoter-centered interactions in the representative imprinted gene MAGEL2. Haplotype-resolved Hi-C maps (left), 3D structural models (middle), and interaction metaplots (right) of promoter-centered regions across replicates and tissues. Enhanced paternal allele-specific interactions between the promoter and its 200-kb upstream regions. Black lines in metaplots show interactions of the other parental allele. Hi-C maps at 5-kb resolution were used to generate these graphs.


