
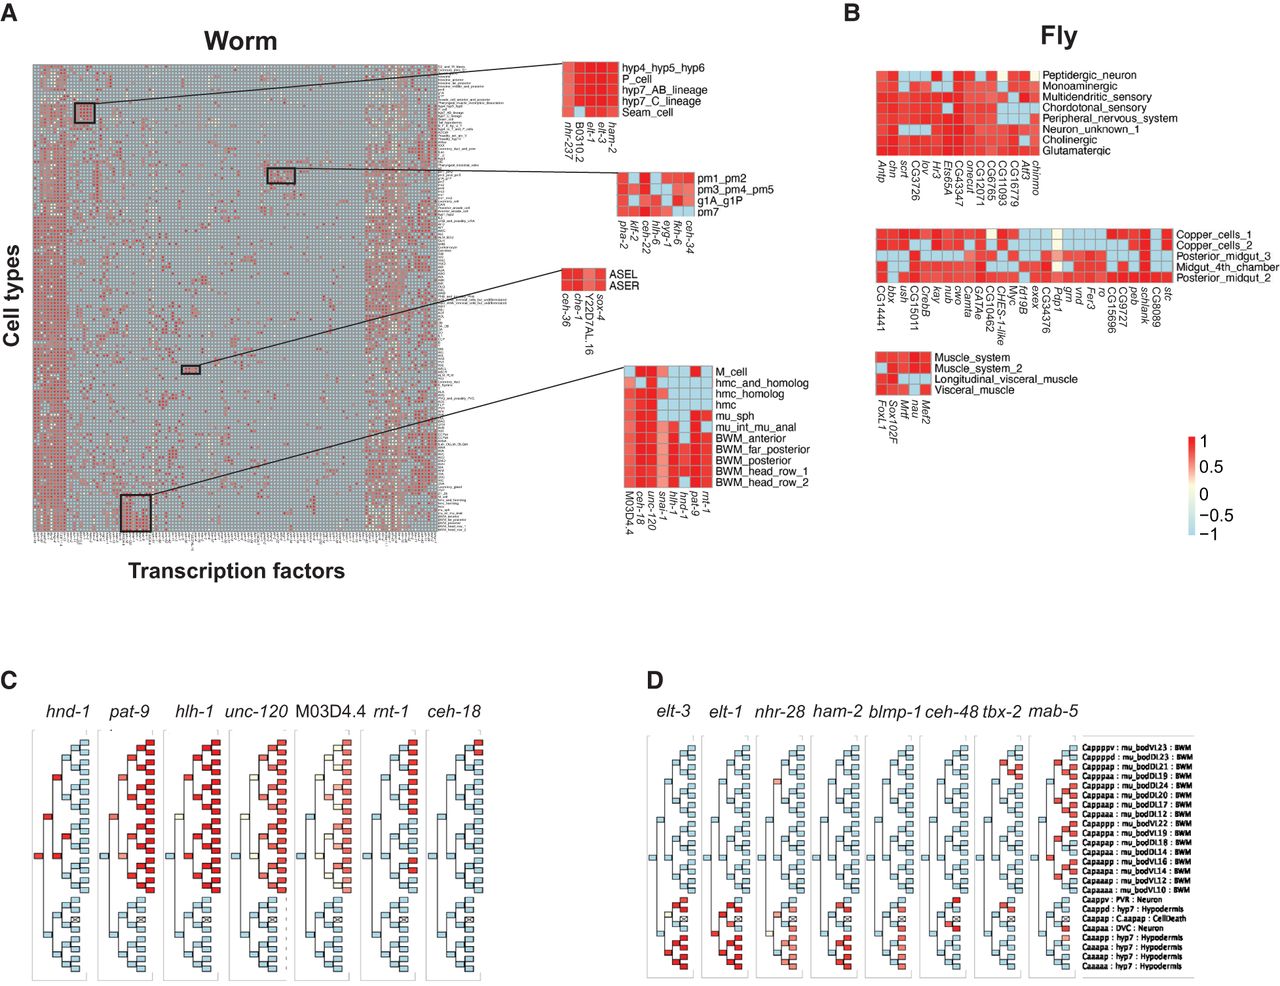
The relative importance of TFs in cell type gene expression. (A) A heatmap of the relative importance of worm TFs in predicting gene expression in the embryo terminal cell types. The importance is indicated by the intensity of the red color from yellow (no importance) to dark red (most important). Light blue indicates that the factor was not expressed above the threshold in that cell type. Clusters of TFs and cell types (black boxes) are blown up on the right, showing the detected relationships of well-studied and novel TFs and the cell types in which they are important. (B) Clusters of fly TFs and cell types in which they are important, selected from the full heatmap in Supplemental Figure S7. Color scale as in A. (C,D) TFs are important in the Ca lineage. (C) TFs are important in the Cap lineage, which produces exclusively body wall muscle cells and are arranged by the onset of their importance. (D) TFs are important in the Caa lineage or in patterned expression in both lineages. The Caa lineage produces primarily hypodermal cells but also some neurons and cell deaths. The lineage names are given on the right, along with the specific cell type in the embryo. Body wall muscle cells are labeled mu_bod followed by letters to indicate Dorsal/Ventral, L/R, and a number indicating the row of the cell, with 24 most posterior. Color scale as in A. Cell types not detected in the single-cell data are indicated by an X.


