
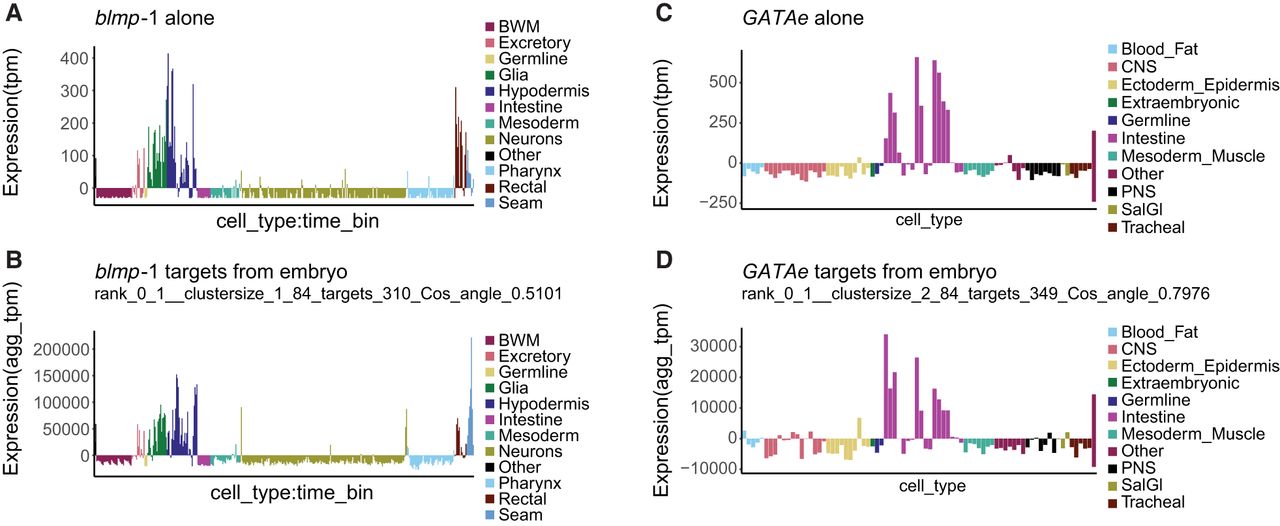
Figure 6.
TF expression correlates with target gene expression. (A–D) Aggregate target expression reflects the TF expression for the worm blmp-1 (A) TF and (B) targets, and the fly GATAe (C) TF and (D) targets. Cell types are arranged along the x-axis by broad cell class and sorted alphabetically within each class. The worm cell types are further divided into time bins (from Supplemental Files S6, S7; Packer et al. 2019).


