
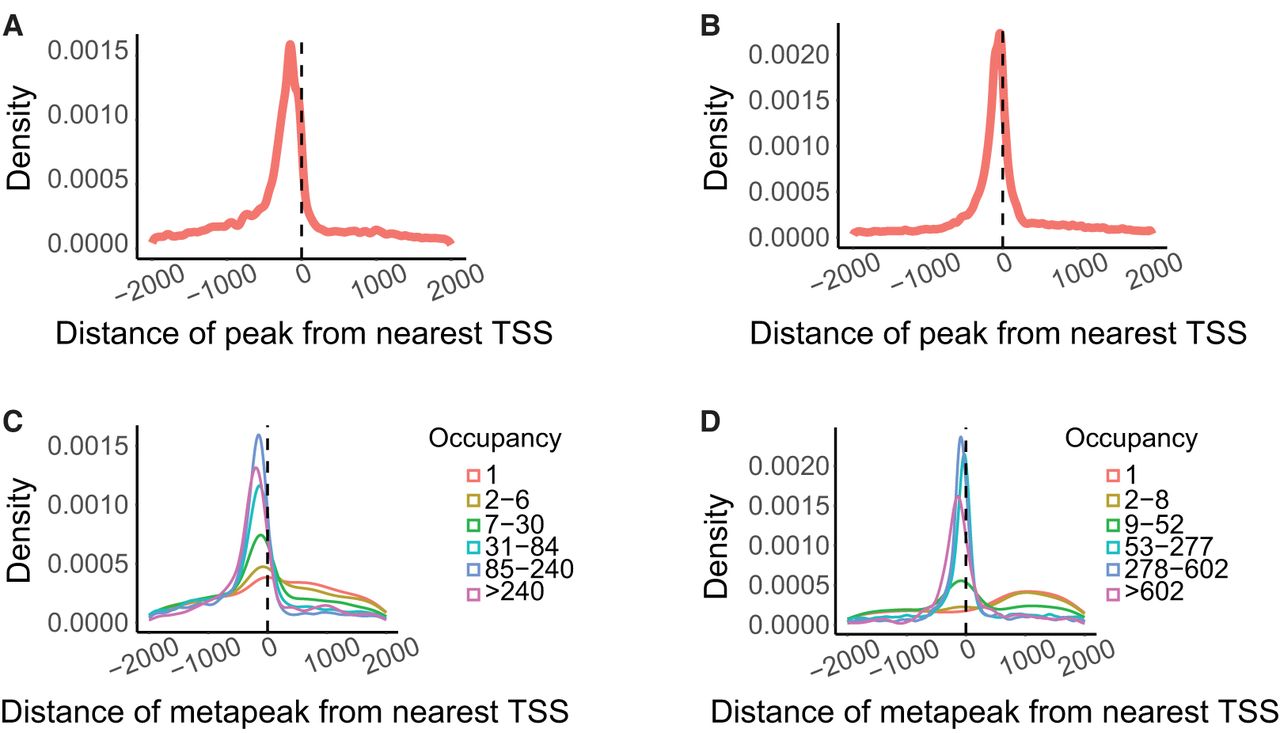
Figure 5.
Peak position relative to TSS. (A,B) Peaks in worms (A) and flies (B) predominantly lie close to the TSS of the nearest gene. Worm peaks are slightly farther from the TSS, possibly reflecting the use of splice leaders in worm transcripts, so that the actual start of transcription is further upstream. The hint of two different distributions may reflect those genes with a splice leader and those without. (C,D) Metapeaks with few peaks—less than or equal to six in the worm (C) and less than or equal to eight in the fly (D)—are more broadly distributed.


