
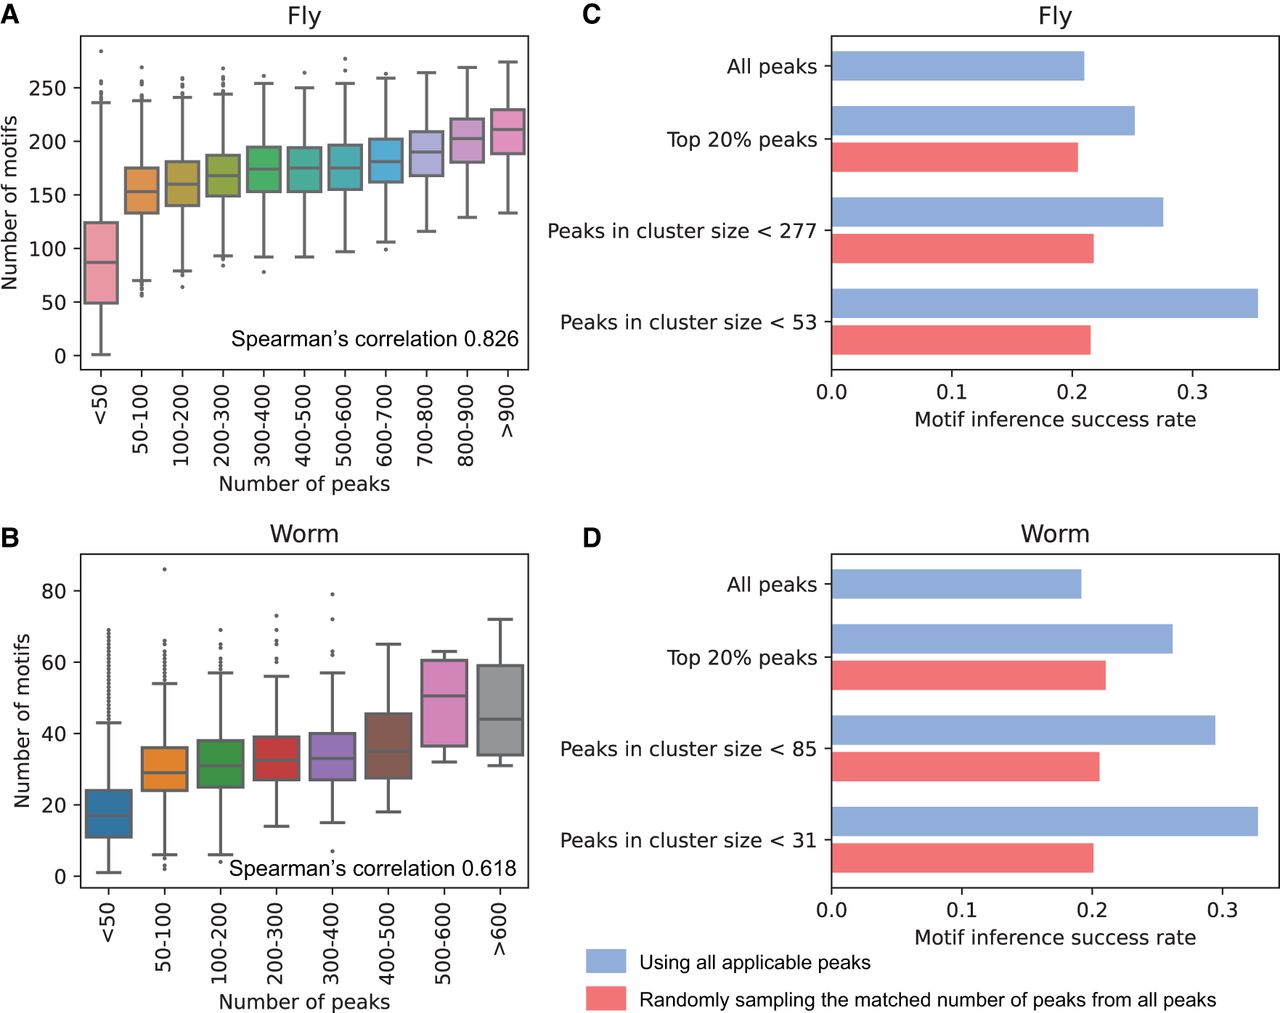
Motif analysis in the metapeaks. (A,B) The number of peaks in a metapeak region was highly correlated with the motifs in the region for both fly (A) and worm (B). The Spearman's correlations for each are shown. Utilizing the ChIP-seq data to obtain motifs, we found using a more stringent peak cluster threshold of 53 for fly (C) and 31 for worm (D) resulted in a better motif inference success rate compared to using all peaks, the top 20% of peaks, or a larger cluster size. For each subset, we randomly sampled the same number of peaks from all peaks for better comparison (shown in red). This sampling process was repeated three times and the average value was shown.


