
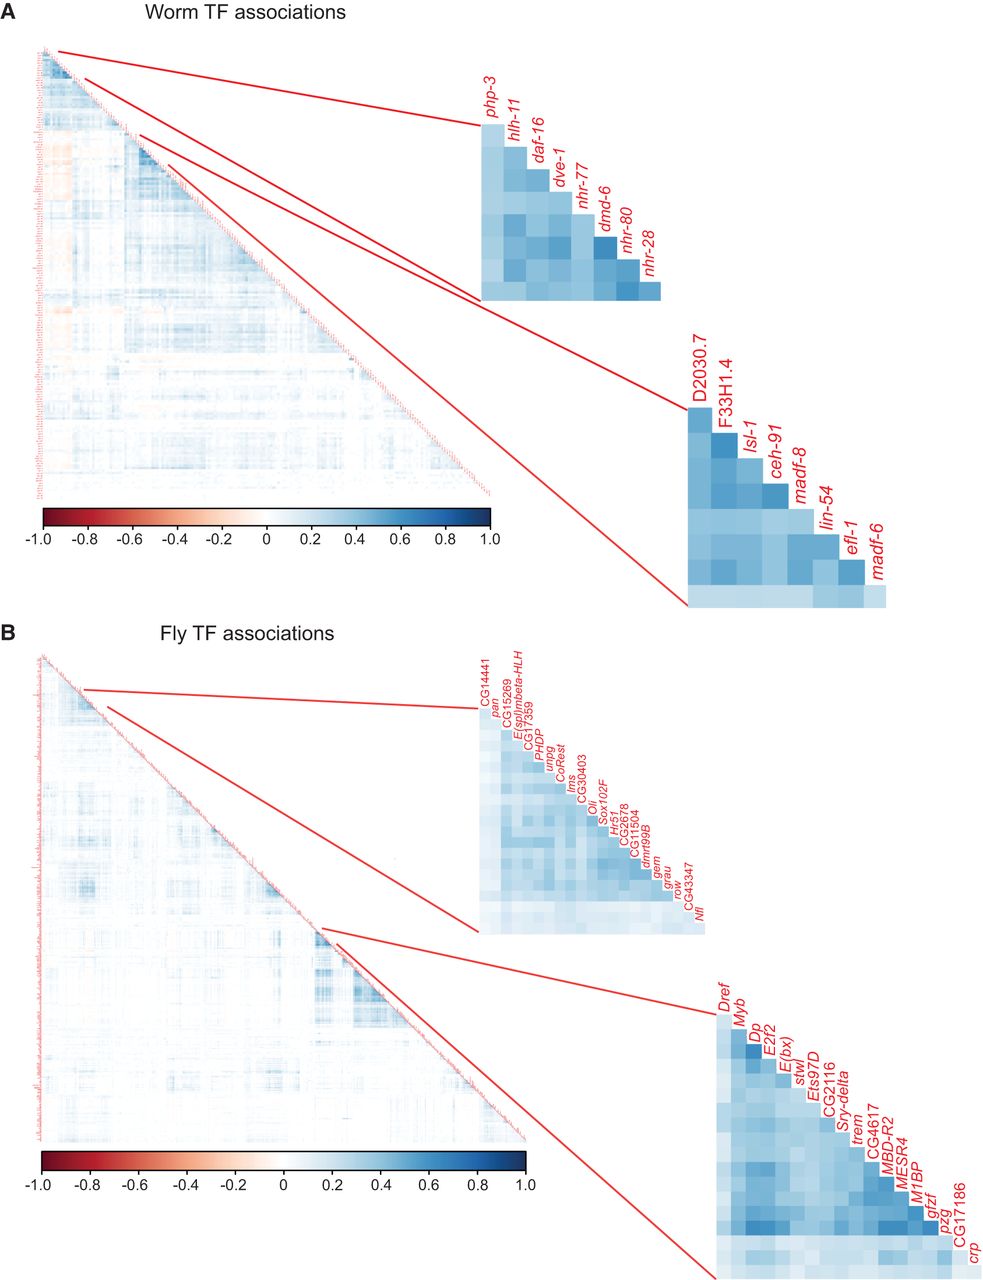
Figure 3.
Correlation of TF–TF pairs. Peaks of some TF pairs occur in the same metapeaks more frequently than others as measured by Pearson's correlation for both worm L4/YA experiments (A) and fly embryo experiments (B). Two clusters of TFs with correlated peaks are highlighted for each species but others are also evident. Negative associations are evident on the left side of the worm plot.


