
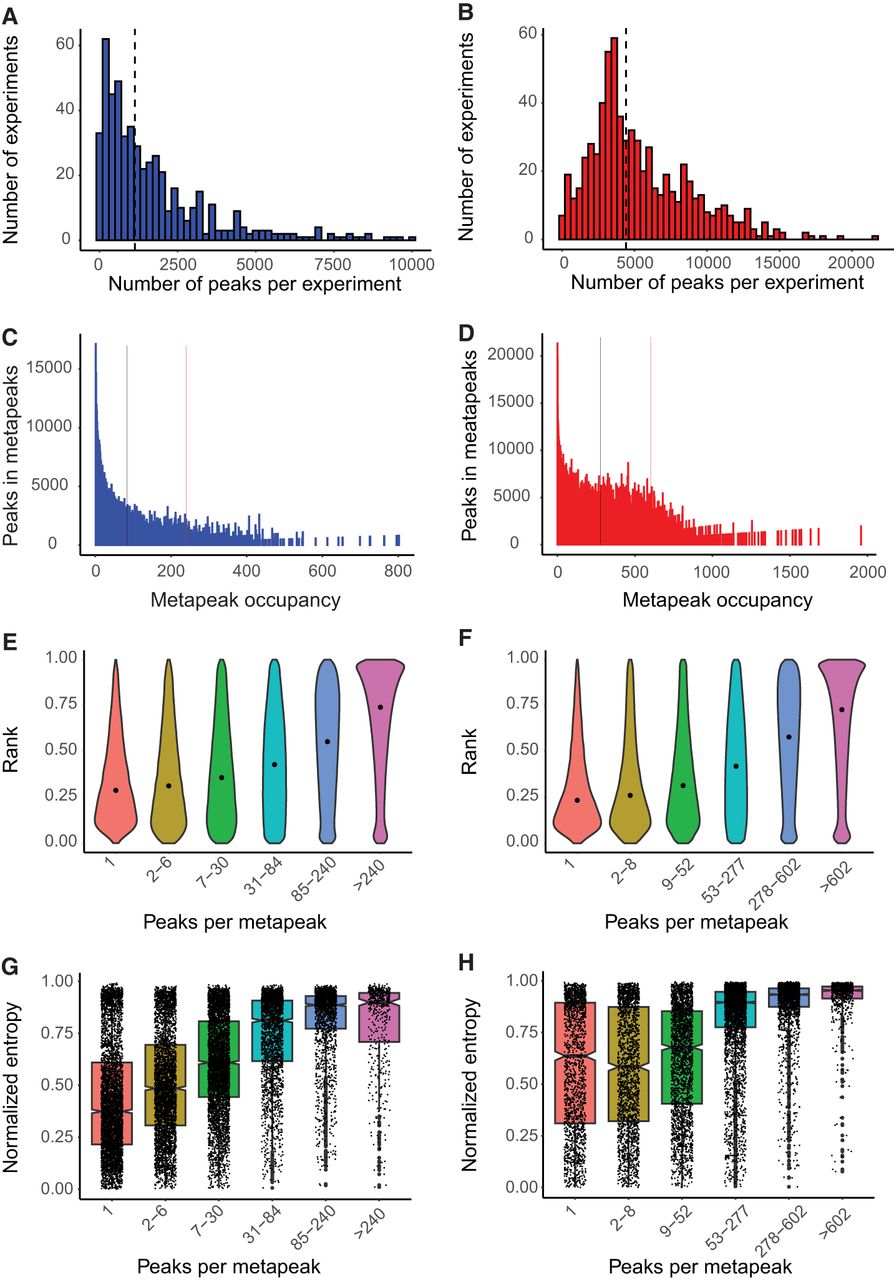
Peaks and metapeaks. (A,B) Number of peaks per experiment (A) for the worm and (B) for the fly. Vertical lines denote the median number of peaks in worm (1130) and fly (4416). (C,D) The total number of peaks in metapeaks declines rapidly with increasing metapeak occupancy (the number of peaks in an individual metapeak) in both worm (C) and fly (D). The vertical bars indicate the thresholds used to define HOT (left) and ultra-HOT (right) sites in each species (84 and 240 peaks, respectively, in the worm and 277 and 602 peaks in the fly). (E,F) In worm (E) and fly (F), the relative rank of the signal strength of peaks within metapeaks increases with metapeak occupancy. (G,H) Both worm (G) and fly (H) targets of high-occupancy metapeaks show a predominance of high entropy genes (more uniform expression), while targets with lower occupancy metapeaks show lower entropy, indicating more cell-type-specific expression. The entropy of fly genes is shifted higher in the fly than in the worm.


