
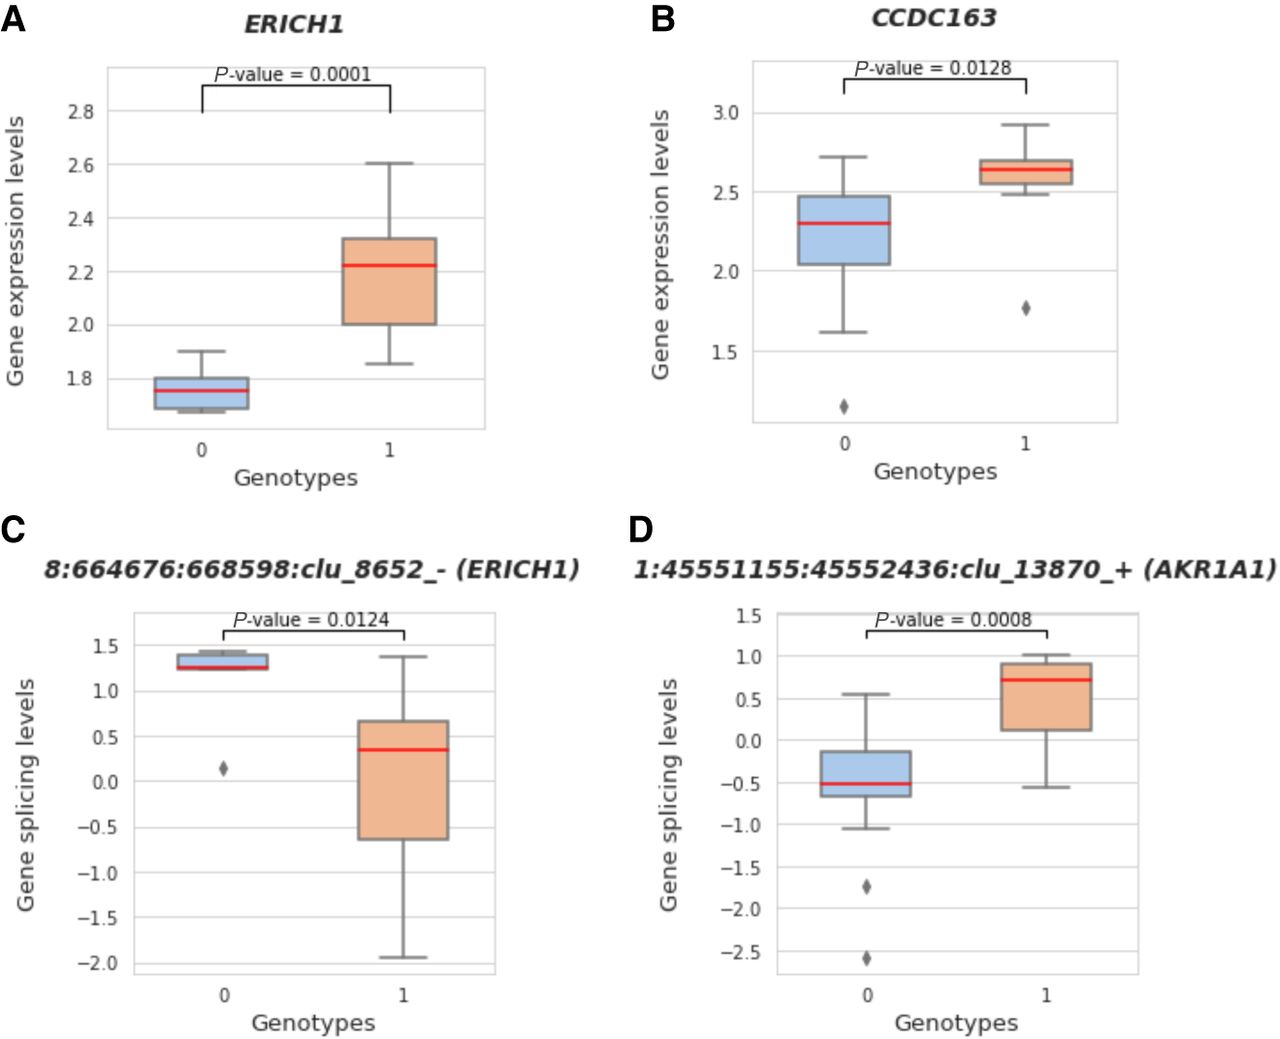
Visualization of two SVs that disrupt TAD boundaries with significant changes in gene expression and splicing levels. (A) Boxplot demonstrates the significant difference in gene expression for two different genotype categories, 0 (genotype 0/0) and 1 (genotypes 0/1, 1/0, or 1/1). The boxplot on the left shows the significant changes between the associated ERICH1 gene expression values (after log transformation) and different genotypes of this deletion Chr 8-644401-DEL-5014. (C) Boxplot shows the significant difference between gene splice ratios (after log transformation and quantile normalization) for the splice junction clusters and genotypes of the same deletion, which is also associated with the ERICH1 gene. (B,D) The same comparisons for an example of insertion (Chr 1-45497763-INS-354) associated with the CCDC163 and AKR1A1 genes between genotype categories 0 and 1.


