
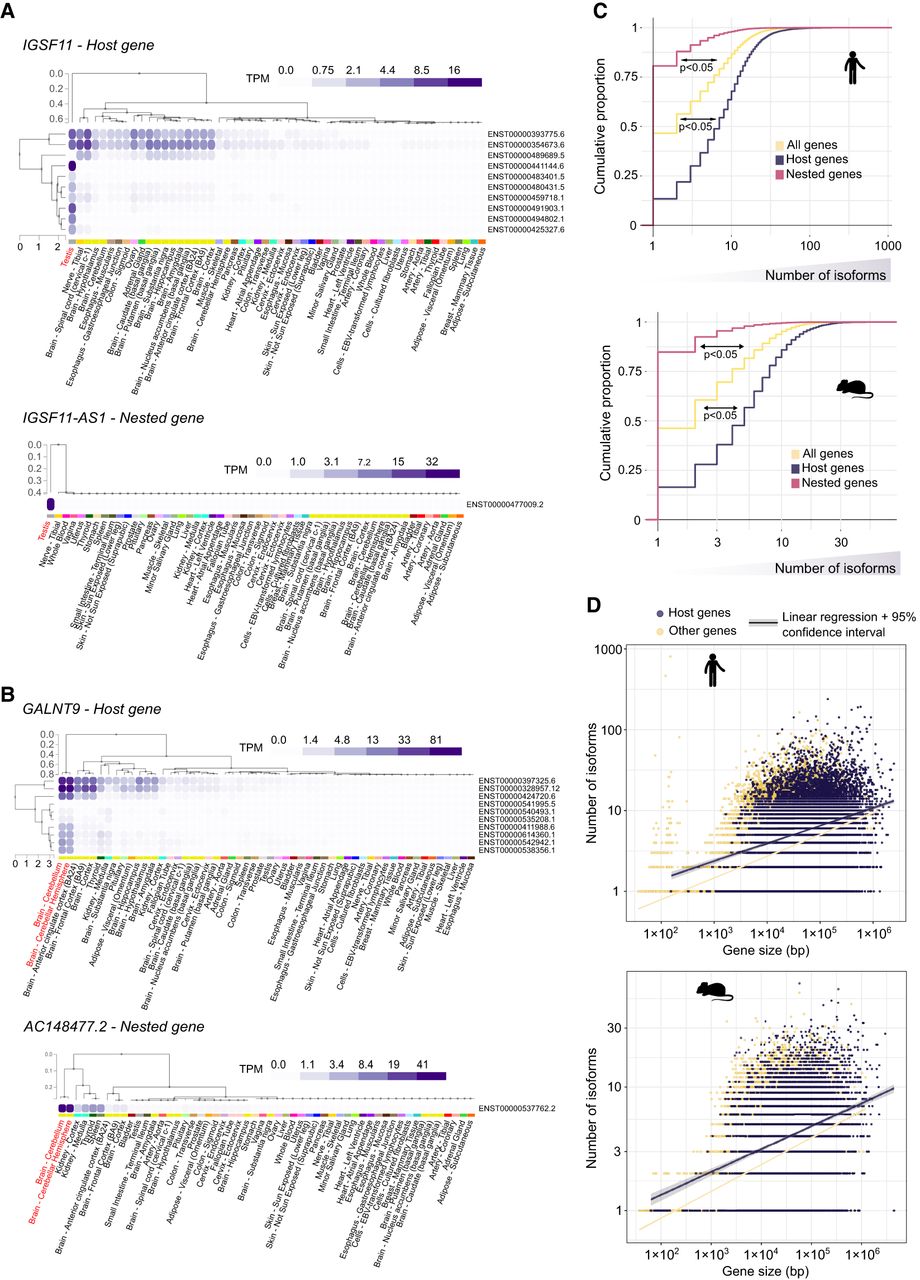
Host and nested gene coexpression is correlated with regulation of isoform diversity. (A) Profile of expression of the different isoforms (rows) of the IGSF11/IGSF11-AS1 pair in different tissues (columns) from the GTEx portal data on isoforms expression (https://gtexportal.org/home/). Isoform and tissue were ordered by hierarchal clustering using the Euclidean distance and average linkages. Tissues where coexpression is happening are in red. (B) Profile of expression of the different isoforms (rows) of the GALNT9/AC148477.2 pair in different tissues (columns) from the GTEx portal data on isoforms expression (https://gtexportal.org/home/). Isoform and tissue were ordered by hierarchal clustering using the Euclidean distance and average linkages. Tissues where coexpression is happening are in red. (C) Cumulative proportion of the number of isoforms for host genes, nested genes, and all genes. A base-10 log scale was used for the number of isoforms. The significance of the difference was tested using a DTS statistic test to compare the empirical cumulative distribution functions (ECDFs) (Dowd 2020). The resulting P-values are mentioned on the graph. (D) Scatter plot showing the isoform number according to gene size (of the longest isoform) for host genes and nonhost genes. A base-10 log scale was used for the number of isoforms and the gene size. Linear regression analysis was computed and the regression line was added on the graph alongside the calculated 95% confidence intervals.


