
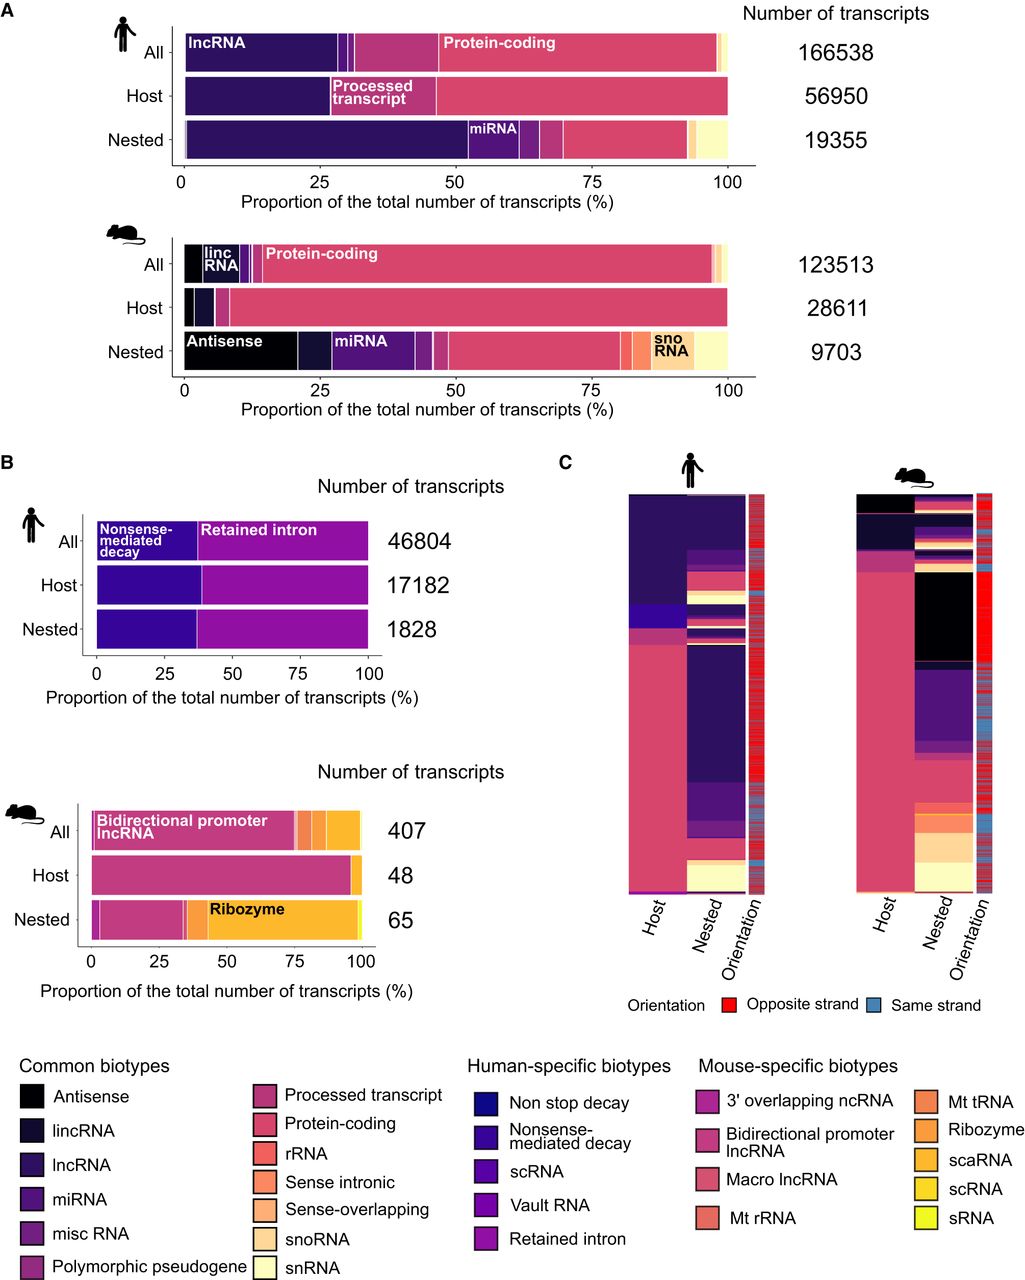
Figure 3.
Host and nested gene biotypes. (A) Bar chart representing the proportions of biotypes which are common across both species. Proportions are displayed for all genes, host genes, and nested genes in human and mouse genomes. (B) Bar chart representing proportions of biotypes unique to human and mouse genomes across all genes, host genes, and nested genes. (C) Heatmap showing the correspondence between host and nested gene biotypes per pair and their orientation to each other.


