
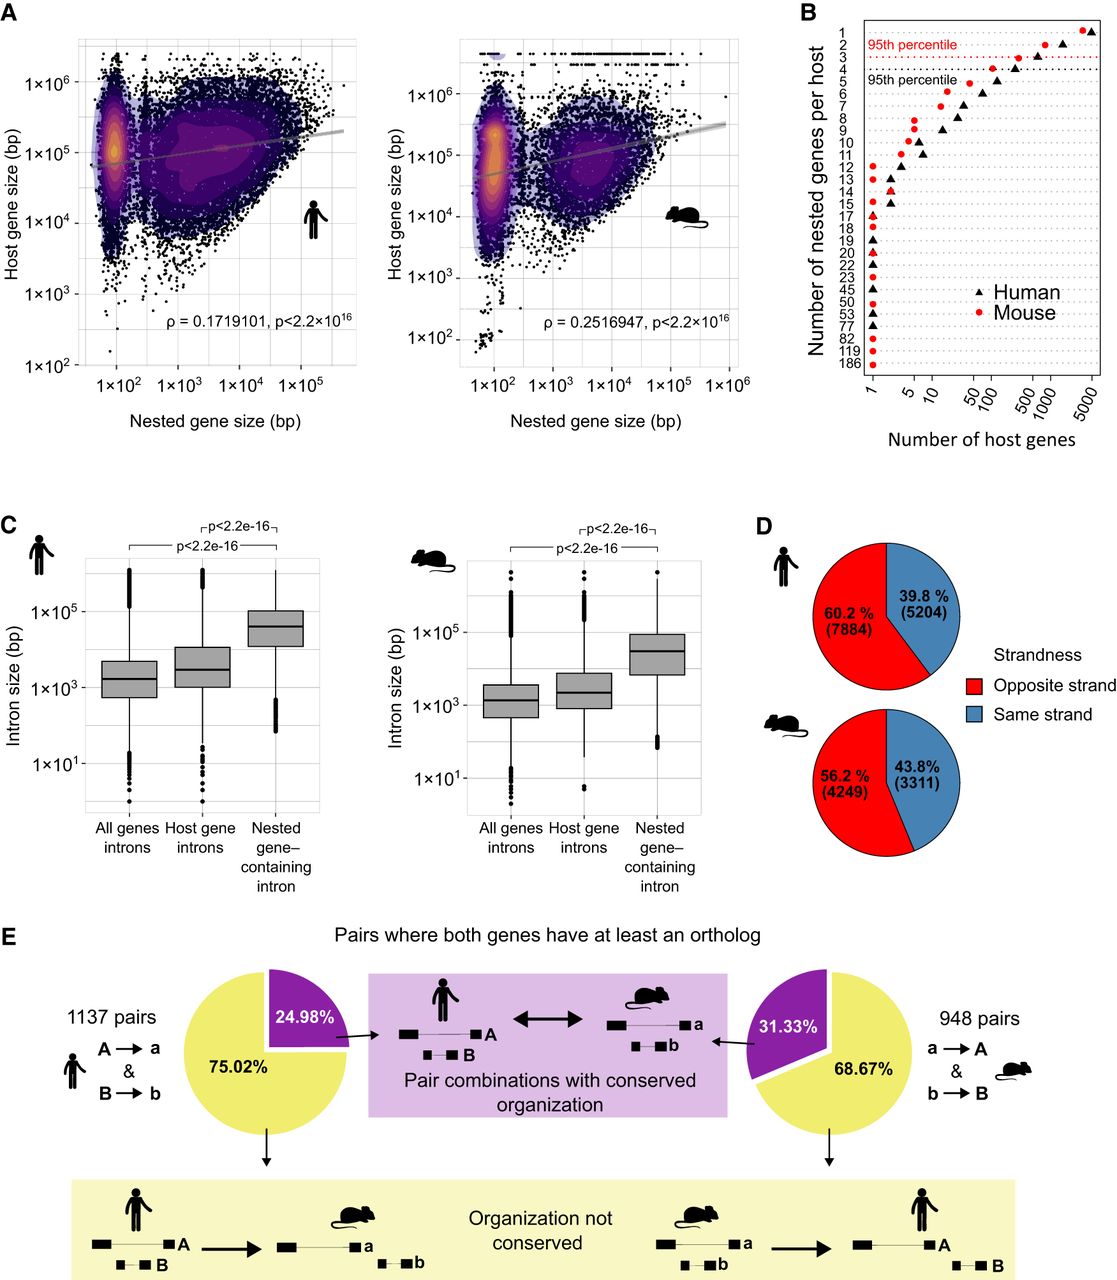
Host/nested gene pairs in mouse and human show similar characteristics. (A) Scatter plot showing the correspondence between the sizes of host and nested genes. The color gradient indicates the density. A base-10 log scale was used for the gene size. Spearman's correlation coefficient was determined which is shown on the graph alongside the resultant P-value. Linear regression analysis was computed and the regression line was added on the graph alongside the calculated 95% confidence intervals. (B) Scatter plots showing the number of nested genes per host. The dotted line represents the 95th percentile of the distribution. A base-10 log scale was used for the number of host genes. (C) Distribution of the intron size for all introns in all the genes, all introns in host genes, or the intron of the host containing a nested gene. A base-10 log scale was used for the intron size. The significance of the difference was tested using a Welch two sample t-test. The resulting P-value is mentioned on the graph. (D) The proportion of host/nested gene pairs with both genes in the same orientation or in the opposite direction. (E) Overlap and conservation between the pairs having an ortholog for both host and nested in the other species.


