
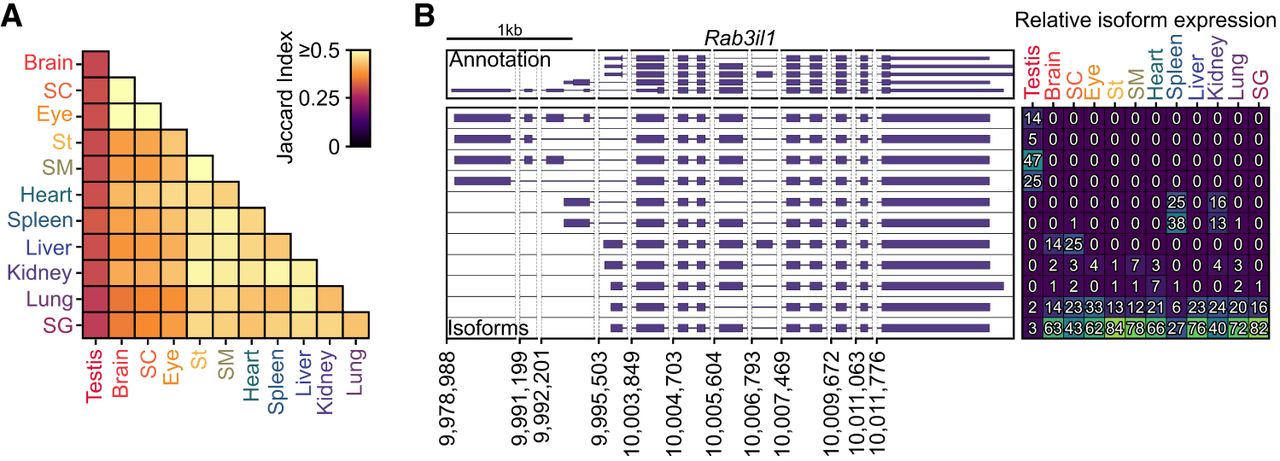
Figure 6.
Differential isoform usage. (A) Jaccard indexes for each pair of tissues, (B) Genome Browser shot of Rab3il1 is shown with GENCODE vM30 annotation on top and isoforms called by Mandalorion below. Right side, the relative usage of each isoform in each tissue, yellow indicates higher usage, blue indicates lower usage. (SC) spinal cord, (St) stomach, (SM) skeletal muscle, (SG) salivary gland.


