
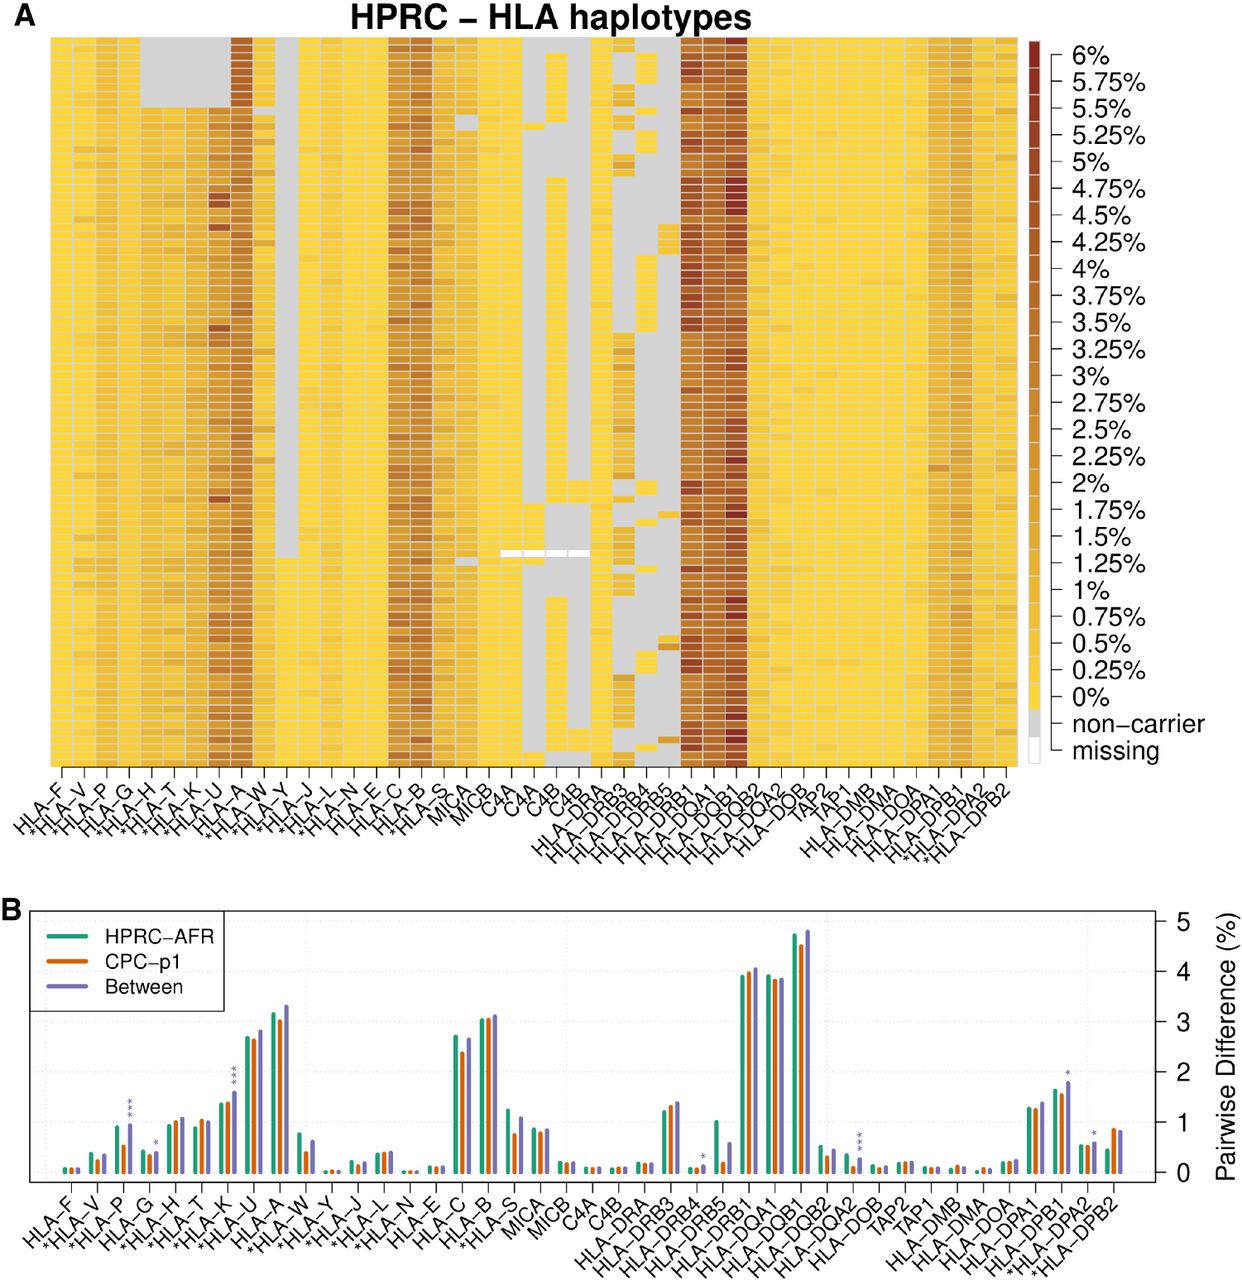
The diversity of HLA coding sequences. (A) HLA haplotypes among HPRC samples. Each row represents one HLA haplotype. For each haplotype, heat from light yellow to the dark brown indicates the average pairwise CDS divergence between the haplotype and all the other haplotypes. A gray box denotes the deletion of a gene in the middle of a contig, and a white box denotes an unassembled gene in assembly gaps. A version with detailed HPRC haplotype names is included as Supplemental Figure S10. (B) HLA within-population diversity and between-population divergence. Each group of bars shows average pairwise CDS difference within HPRC African samples (AFR; n_hap = 24), within CPC Asian samples (n_hap = 114), and between the two populations. Permutation tests were performed to test whether the two populations are distinguishable in terms of CDS divergence. P-values are adjusted with the Bonferroni method. Number of stars indicates different significance level: (*) P-value < 0.05, (**) P-value < 0.01, (***) P-value < 0.001.


