
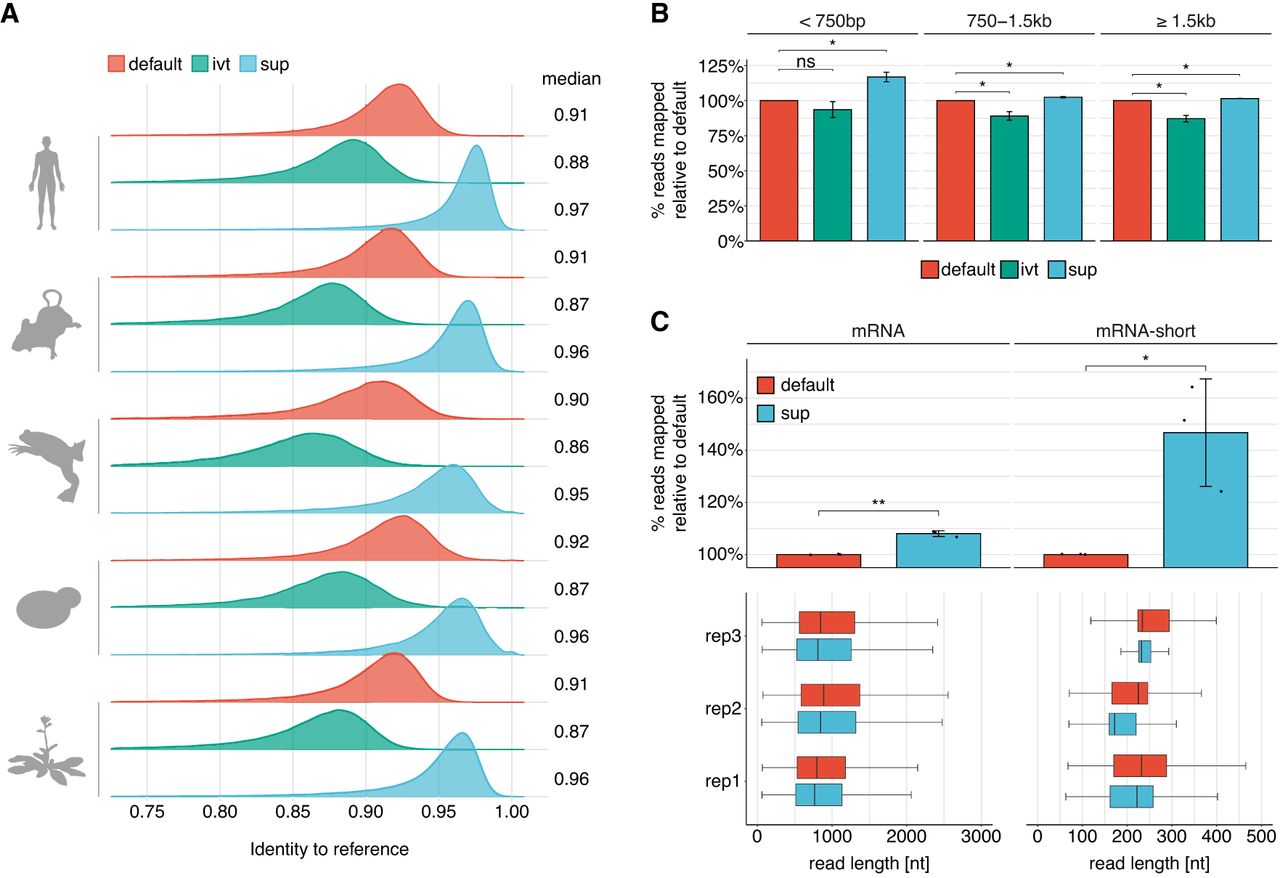
SUP is a super high accuracy model that leads to improved read accuracy and mapping. (A) Cross species comparison of read accuracies obtained from each model. Reads were aligned to the respective reference transcriptome (see Supplemental Table S5). To account for vastly different expression levels that would bias the analysis toward strongly expressed genes, we filtered for the longest reads of each transcript, keeping at most 10 reads per transcript. (B) Comparison of reads mapped to the human reference transcriptome (n = 3) across three bins of read lengths. Error bars indicate ± 1 SD. Statistical significance was determined using a two-sided t-test, corrected for multiple hypothesis testing using the Benjamini–Hochberg procedure: (ns) P ≥ 0.05, (*) P < 0.05). (C) Effect of distinct basecalling models on the proportion of mapped reads obtained from standard poly(A)-selected human samples (median length ≅ 850 bp) and a synthetic RNA library consisting of three polyadenylated in vitro transcripts (median length ≅ 200 nt). Statistical significance was determined using a one-sided t-test, and results were corrected for multiple hypothesis testing using the Benjamini–Hochberg procedure: (ns) P ≥ 0.05, (*) P < 0.05, (**) P < 0.01. Box plots depict the underlying size distribution of the sequenced libraries. The box is limited by the lower-quartile Q1 (bottom) and upper-quartile Q3 (top). Whiskers are defined as 1.5 × IQR with outliers being removed.


