
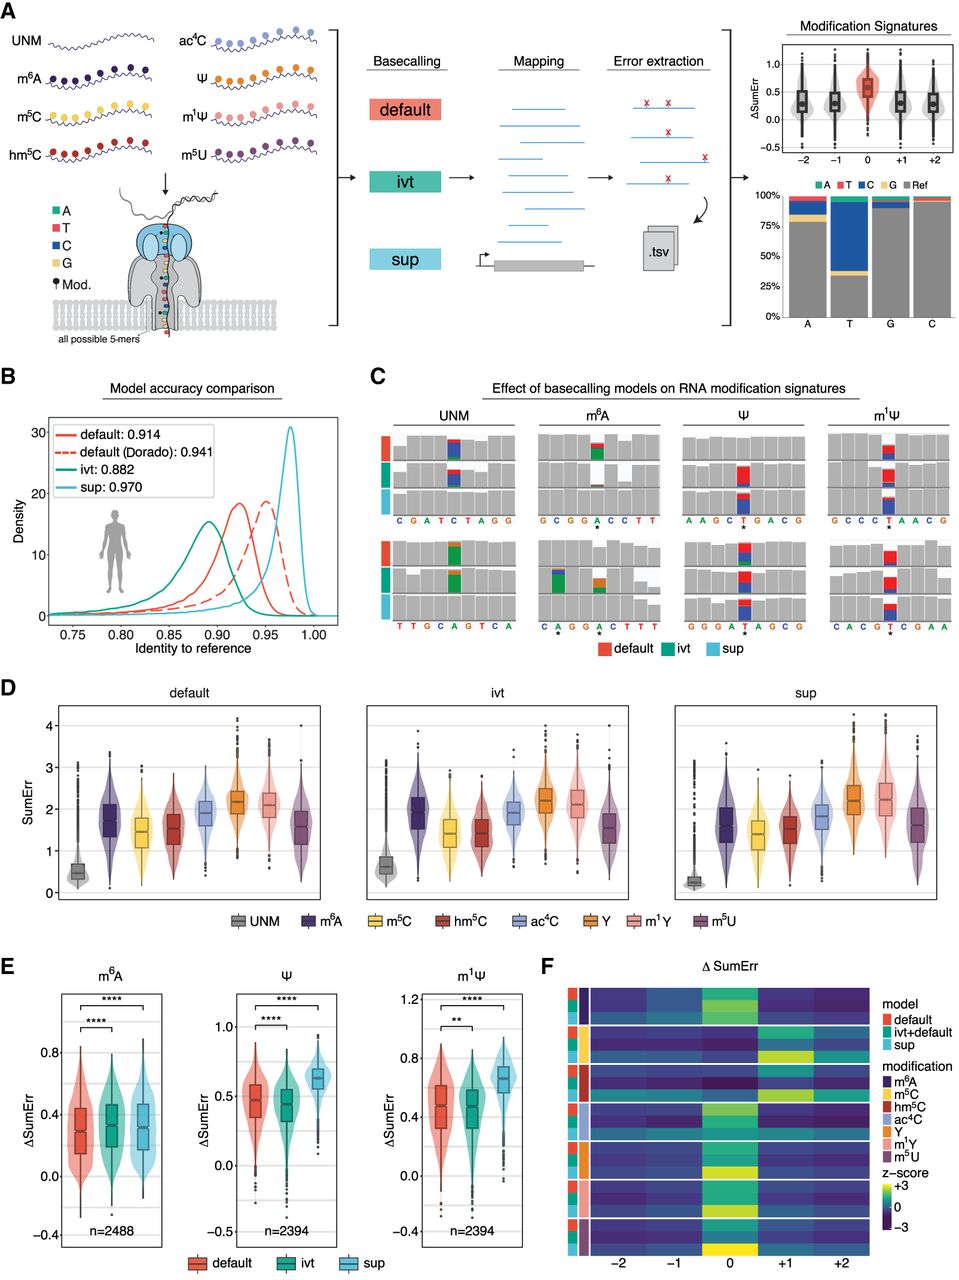
Benchmarking RNA basecalling models and their effect on basecalling accuracy and RNA modification detection. (A) Schematic overview of the in vitro “curlcakes” used in this work, depicting the seven different modification types that were sequenced (m6A, m5C, hm5C, ac4C, Ψ, m1Ψ, and m5U) and the three RNA basecalling models benchmarked (default, IVT, and SUP). To assess the performance of tested RNA basecalling models, error signatures (mismatch, deletion, and insertion frequency) were used. (B) Comparison of basecalling accuracies obtained from each RNA basecalling model on human transcriptomic data (see Methods). The curve represents the density of the per-read identities for each model. Solid lines represent Guppy, and dashed lines represent Dorado as basecalling software. We would like to note that a subset of reads from the HEK293T samples used here was also used for training our “SUP” model (see Methods); however, see also Figure 4A, which shows similar accuracy for SUP model in other species/data sets not included in model training. (C) IGV snapshots showing the effect of using either default, IVT, or SUP models on unmodified (UNM) or modified (m6A, Ψ, and m1Ψ) “curlcake” sequences for two positions each (top and bottom row). Asterisks indicate modified sites. Positions at which the mismatch frequency exceeds 0.2 are colored, and deletions are visualized as drop in coverage. (D) Comparison of the summed errors (mismatch, deletion, and, insertion frequency) for all 5-mers with a central modified base for the three tested basecalling models (default, IVT, and SUP). (E) Box plots showing the delta summed error for 5-mers of selected modifications (m6A, Ψ, and m1Ψ) at the central (modified) position. For equivalent plots of the remaining RNA modifications tested (m5C, hm5C, ac4C, and m5U), see Supplemental Figure S2B. Statistical analysis was performed using a two-sided nonparametric Wilcoxon test with “default” as the reference group. Results were corrected for multiple-hypothesis testing using the Benjamini–Hochberg procedure to obtain adjusted P-values: (ns) P > 0.05, (*) P ≤ 0.05, (**) P ≤ 0.01, (***) P ≤ 0.001, (****) P ≤ 0.0001. The sample size reported by n represents the number of 5-mers contributing to each box plot per panel. For D and E, the box is limited by the lower-quartile Q1 (bottom) and upper-quartile Q3 (top). Whiskers are defined as 1.5 × IQR with outliers represented as individual dots. (F) Comparison of the median delta summed error (=SumErrMOD − SumErrUNM) for centrally modified (position 0) 5-mers. A Z-score normalization per modification (see Methods) was performed to highlight the effect that different basecalling models have on the obtained delta summed error. Unscaled results are reported in Supplemental Figure S2B.


