
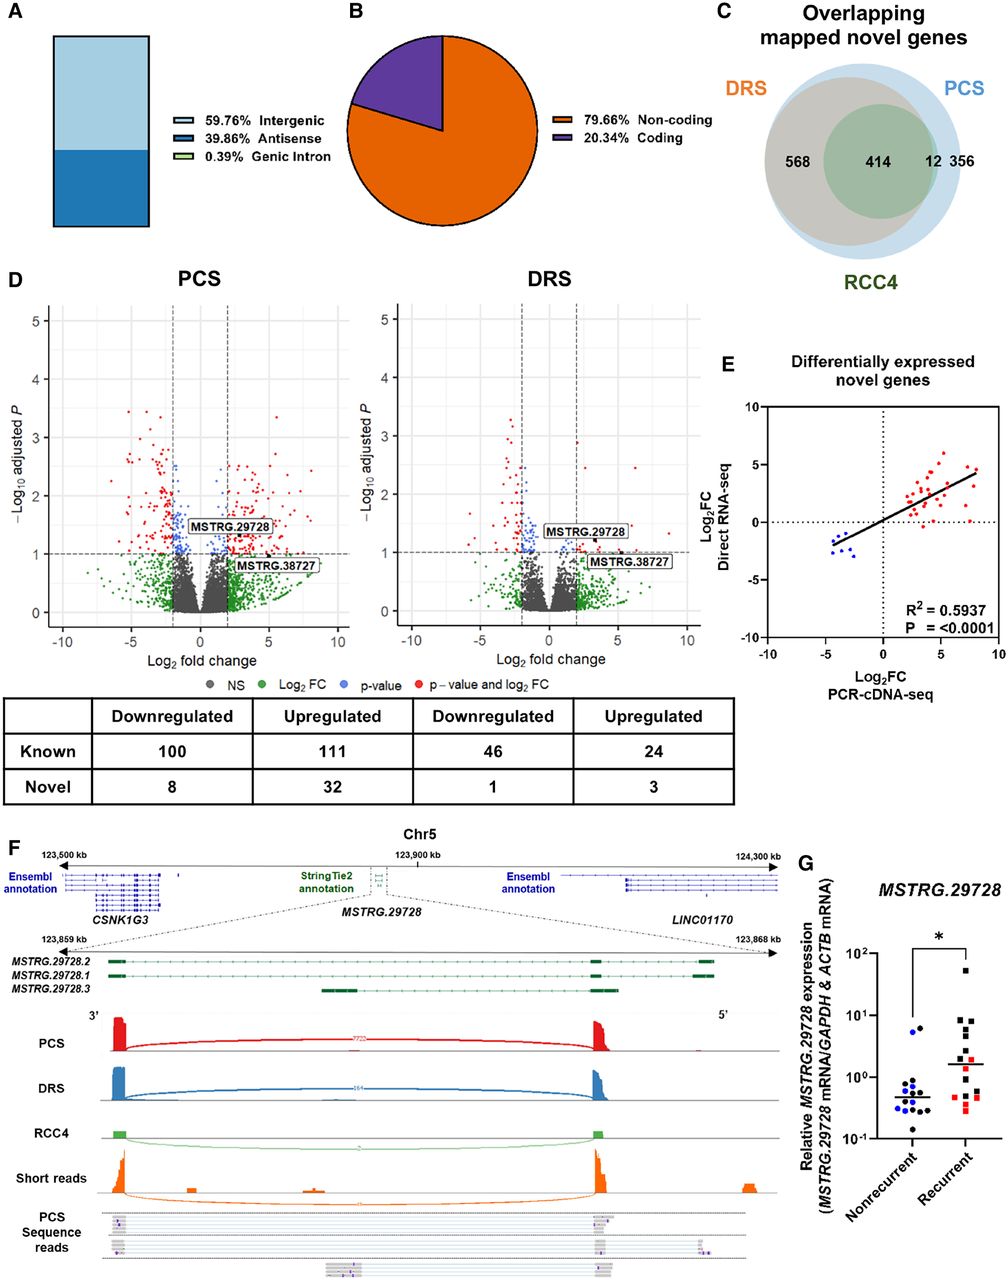
Discovery of ccRCC recurrence-associated novel genes by long-read RNA-seq. (A) Bar chart showing the isoform classifications of StringTie2 assembled transcripts from novel genes as classified by SQANTI3. (B) Pie chart illustrating the proportion of coding and noncoding StringTie2 assembled transcripts from novel genes as classified by SQANTI3. (C) Venn diagram showing the number of overlapping mapped novel genes between PCS and DRS of ccRCC tumor samples, and DRS of RCC4. (D) Volcano plots showing DEGs (red) between recurrent and nonrecurrent tumors from PCS and DRS data using StringTie2 assembled reference. Number of differentially expressed novel and known genes are shown in table below plots. Names of novel genes that were validated by qPCR with validation cohort are shown on plots. (E) Correlation between log2FoldChange of differentially expressed novel genes identified by either or both PCS and DRS between recurrent versus nonrecurrent tumors (n = 40). (F) IGV visualization of MSTRG.29728 isoforms StringTie2 reference annotation (green) and the closest neighboring genes (LINC01170 and CSNK1G3) in the Ensembl reference annotation (Ensembl release 105) at Chr 5: 123,500,000–124,300,000 (top track); Sashimi plot showing abundance of reference genome-aligned reads and splicing patterns along MSTRG.29728 (Chr 5: 123,859,000–123,868,000) for PCS (red) and DRS (blue) of ccRCC tumor samples, and DRS (green) and short-read Illumina sequencing (orange) of RCC4; representative PCS sequencing reads (gray) aligned to the reference genome in the region of interest. (G) MSTRG.29728 mRNA levels measured by qRT-PCR in recurrent and nonrecurrent tumors from sequenced cohort (blue and red, n = 12) and validation cohort (black, n = 20), relative to average mRNA levels in nonrecurrent tumors. mRNA levels were normalized to GAPDH and ACTB. Two-tailed Mann–Whitney U test was used with P ≤ 0.05 considered significant. (*) P < 0.05. Center line represents the median for each group.


