
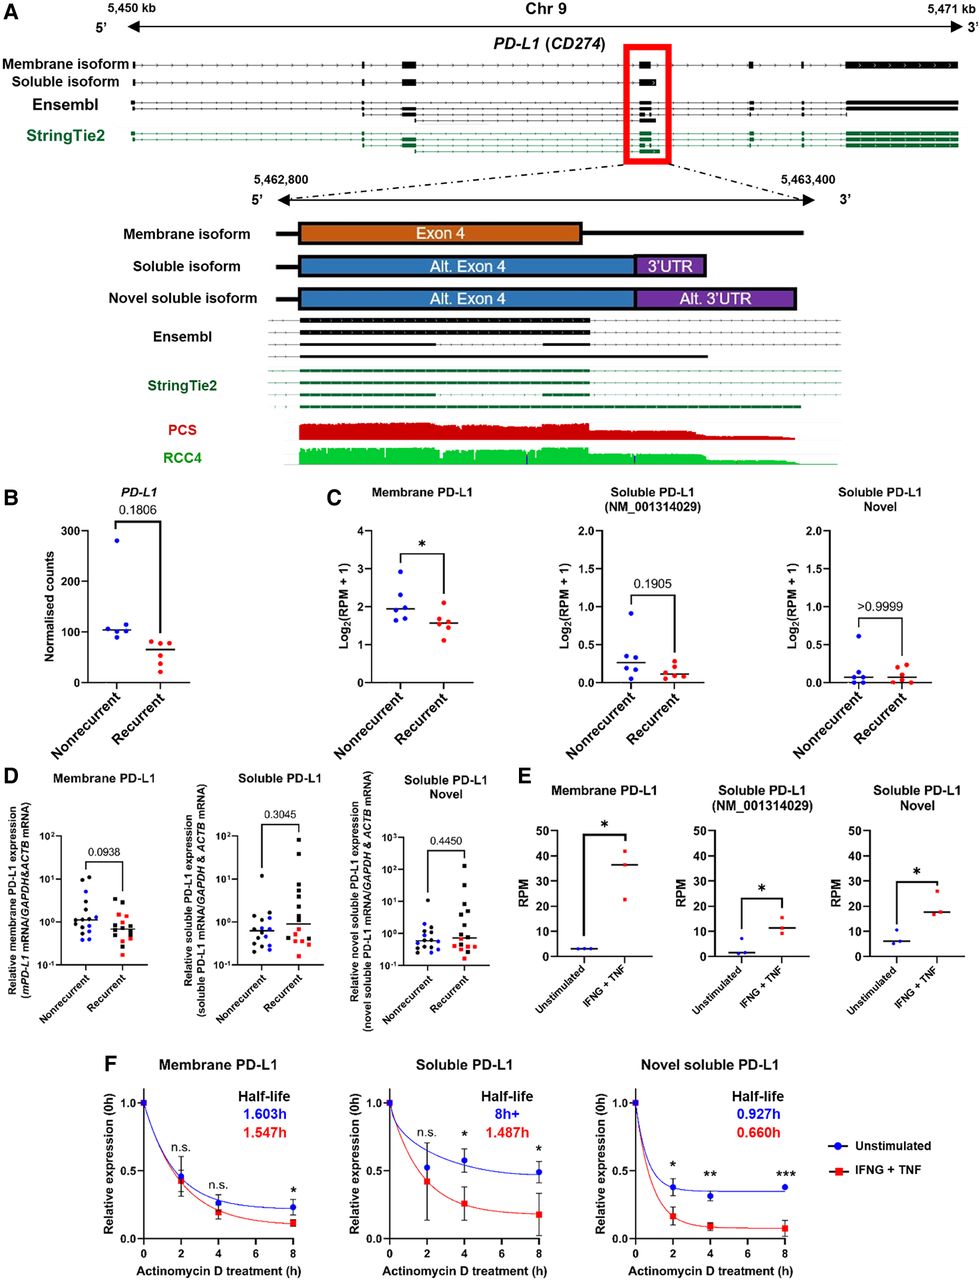
Discovery of a novel sPD-L1 isoform expressed by ccRCC tumor cells. (A) IGV visualization of reference annotation of mPD-L1 isoform (black, ENST00000381577), sPD-L1 (black, NM_001314029), and StringTie2 reference annotation (green) (top tracks); graphical representation of membrane, soluble, and novel soluble PD-L1 exon 4; Ensembl (black) and StringTie2 reference annotations (green) and IGV coverage tracks for PCS of ccRCC tumors (red) and DRS of RCC4 (green). (B) Grouped dot plot showing reference DESeq2 normalized PD-L1 expression in nonrecurrent (blue) and recurrent (red) tumors' PCS data. DESeq2 Padj value is shown in the graph. Center line represents the median for each group. (C) Grouped dot plots showing normalized mPD-L1, sPD-L1, and novel sPD-L1 expression (log2(RPM + 1)) in nonrecurrent (blue) and recurrent (red) tumors’ PCS data. (D) Grouped dot plots showing mPD-L1, sPD-L1 (all isoforms), and novel sPD-L1 mRNA levels measured by qRT-PCR in recurrent and nonrecurrent tumors from sequenced cohort (blue and red, n = 12) and validation cohort (black, n = 20) relative to average mRNA levels in nonrecurrent tumors. (E) Stacked bar graphs representing proportions of mPD-L1, sPD-L1, and novel sPD-L1 isoforms in RCC4 cells based on DRS data. For (C)–(E), two-tailed Mann–Whitney U tests were used with P ≤ 0.05 considered significant. (*) P < 0.05. Center line represents the median for each group. (F) mRNA decay curves for mPD-L1, sPD-L1, and novel sPD-L1 in unstimulated (blue) and IFNG + TNF treated (red) RCC4 cells. Half-lives of isoforms are indicated in the graph (blue for unstimulated, red for IFNG + TNF treated RCC4). Comparisons were made using unpaired Student's t-test with P ≤ 0.05 considered significant. (n.s.) not significant, (*) P < 0.05, (**) P < 0.01, (***) P < 0.001.


