
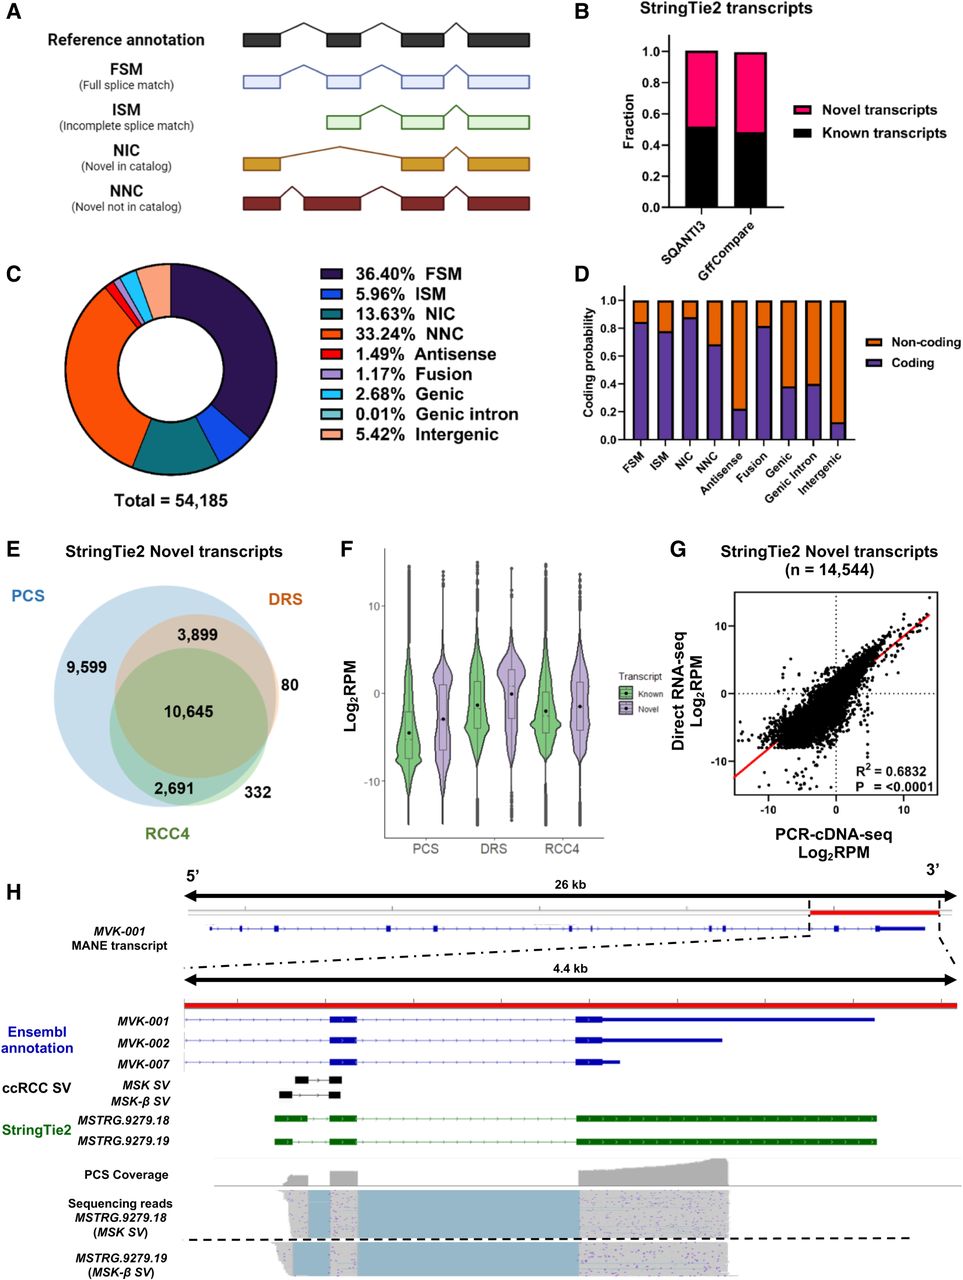
Long-read RNA sequencing enables the discovery of full-length novel transcripts. (A) Graphical representation of the major SQANTI3 isoform categories (antisense, genic intron, genic genomic, and intergenic not shown here). (B) Bar chart showing the proportion of Novel and known transcripts in StringTie2 assembly as curated by SQANTI3 and GffCompare. (C) Pie chart depicting the distribution of SQANTI3 isoform categories among StringTie2 assembled transcripts (n = 54,185). (D) Bar chart showing the proportion of coding and noncoding StringTie2 assembled transcripts by SQANTI3 isoform categories. (E) Venn diagram showing the number of overlapping mapped StringTie2 novel transcripts between PCS and DRS of ccRCC tumor samples, and DRS of ccRCC cell line RCC4. (F) Violin plot showing the expression levels (Log2 RPM) of known and novel transcripts in PCS and DRS of ccRCC tumor samples, and DRS of ccRCC cell line RCC4. The width of the violin plots represents the density of transcripts at different expression levels. Black dots represent mean expression levels. The top and bottom of box plots represent upper and lower quartiles, respectively. (G) Correlation between transcripts expression levels (Log2 RPM) of all StringTie2 novel transcripts mapped by both PCS and DRS (n = 14,544). Diagonal line represents the line of best fit. R2 value was computed to measure goodness-of-fit and P-value was generated from F-test, with P < 0.05 considered statistically significant. Lowest expression values shown correspond to the minimum normalized abundance. (H) IGV visualization of MVK reference annotations (blue), ccRCC-specific MVK splice junctions (black), StringTie2 assembled novel transcripts (green), PCS coverage track (gray) illustrating the depth of sequence coverage across the region of interest (red bar, hg38 Chr 12: 109,594,200–109,598,600) and PCS sequencing reads aligned to the reference genome in the region of interest.


