
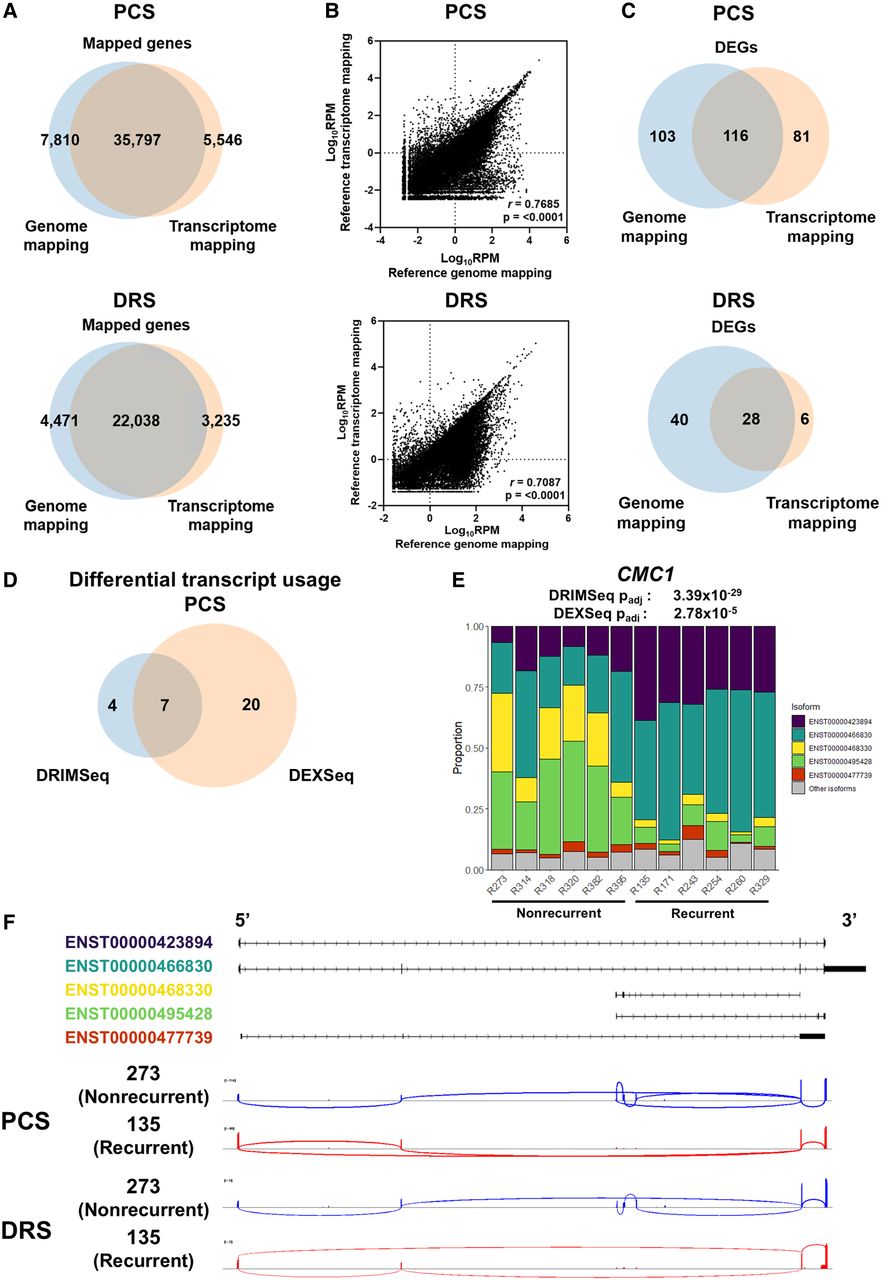
DTU events associated with ccRCC recurrence. (A) Venn diagram showing overlaps between reference genome- and reference transcriptome-alignment method mapped genes in PCS and DRS of nephrectomy samples. (B) Correlation between gene expression levels (Log10 RPM) of all genes mapped by both reference genome-alignment method and reference transcriptome alignment method in PCS (n = 35,797) and DRS (n = 22,038). Diagonal line represents the line of best fit. r value denotes Pearson's correlation coefficient and P-value was generated from F-test, with P < 0.05 considered statistically significant. (C) Venn diagram showing the overlaps of DEGs identified by both between reference genome- and reference transcriptome-alignment method in PCS and DRS of nephrectomy samples. (D) Venn diagram showing the overlaps of genes that displayed significant DTU by DRIMSeq and DEXSeq in PCS nephrectomy samples. (E) Stack bar graphs representing proportions of CMC1 isoforms in ccRCC tumors using PCS data. DRIMSeq and DEXSeq Padj values for DTU of CMC1 are indicated in the graph. (F) Graphical representation of CMC1 isoforms Ensembl reference annotations in Integrative Genomics Viewer (IGV), with black boxes representing exons. Sashimi plots of CMC1 from PCS and DRS recurrent (135) and nonrecurrent (273) ccRCC samples. Junction lines are shown for junction coverages with at least 5% of total CMC1 reads.


