
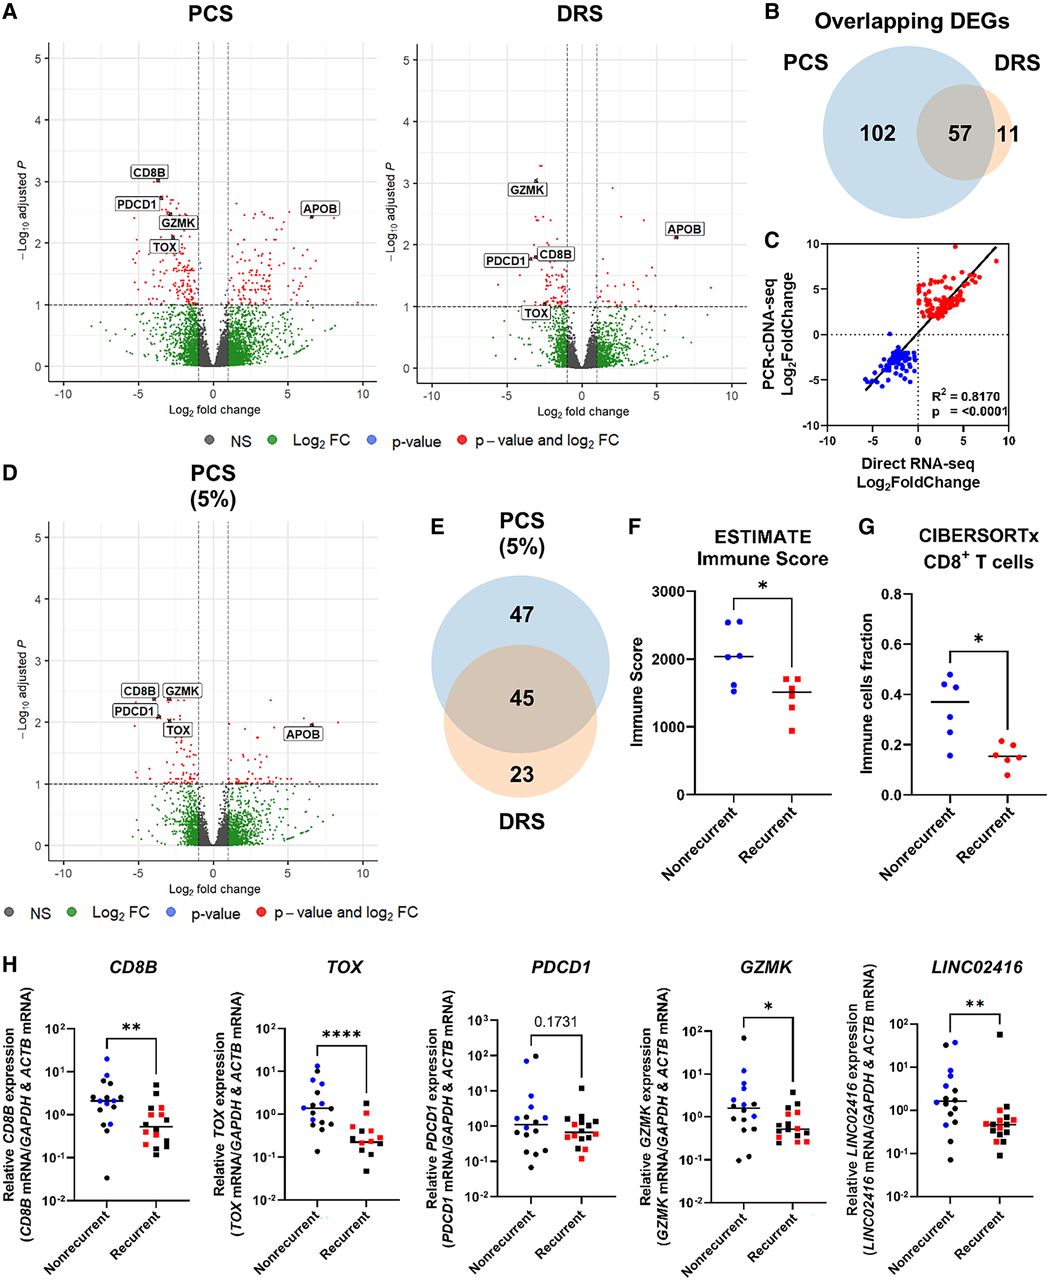
ccRCC recurrence is associated with suppressed tumor immune infiltration. (A) Volcano plots showing DEGs (red) between recurrent and nonrecurrent ccRCC tumors from PCS and DRS data using Ensembl genome reference (Ensembl release 105). (B) Venn diagram showing overlaps of DEGs identified by both PCS and DRS. (C) Correlation between log2FoldChange of DEGs identified by either or both PCS and DRS (recurrent vs. nonrecurrent ccRCC tumors). Diagonal line represents the line of best fit. R2 value was computed to measure goodness-of-fit and P-value was generated from F-test, with P ≤ 0.05 considered statistically significant. (D) Volcano plots showing DEGs (red) between recurrent and nonrecurrent ccRCC tumors from 5% subsampled PCS data using Ensembl genome reference (Ensembl release 105). (E) Venn diagram showing overlaps of DEGs identified by both 5% subsampled PCS and DRS. (F) Grouped dot plot showing an estimated immune score of nonrecurrent (blue) and recurrent (red) ccRCC tumor by the ESTIMATE algorithm, using PCS gene expression data. (G) Grouped dot plot showing the relative population of CD8+ T cells within immune infiltrates of nonrecurrent (blue) and recurrent (red) ccRCC tumors estimated by CIBERSORTx using PCS gene expression data. (H) CD8B, TOX, PD-1, GZMK, and LINC02416 mRNA levels measured by qRT-PCR in recurrent and nonrecurrent tumors from the sequenced cohort (blue and red, n = 12) and validation cohort (black, n = 20), relative to average mRNA levels in nonrecurrent tumors. mRNA levels were normalized to GAPDH and ACTB. For (A) and (D), blue and red dots represent significantly down and upregulated genes by either or both PCS and DRS. Dotted lines indicate the significance threshold (|log2FoldChange| ≥ 2, Padj ≤ 0.1). Names of genes that were validated by qRT-PCR with validation cohort are shown. For (F)–(H), two-tailed Mann–Whitney U tests were used with P ≤ 0.05 considered significant. (*) P < 0.05, (**) P < 0.01, (****) P < 0.0001. Line represents the median for each group.


