
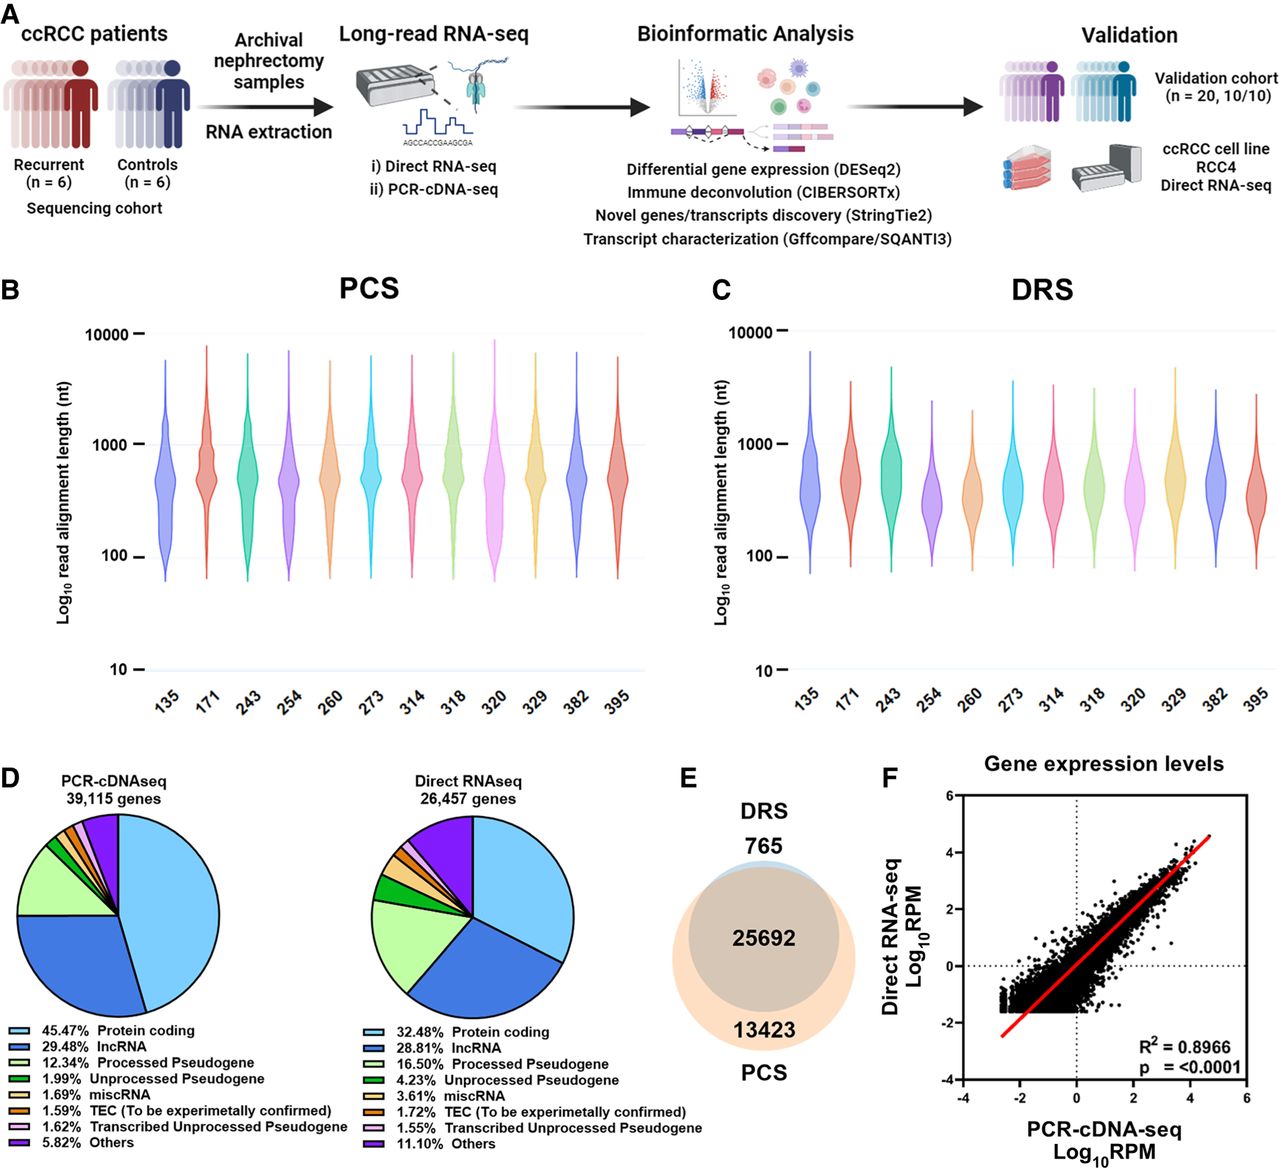
DRS and PCS of ccRCC nephrectomy samples. (A) Summary of study design and data analysis workflow—figure made with BioRender (https://www.biorender.com). (B) Violin plot showing Log10 transformed raw read lengths of passed reads generated by PCS. (C) as in (B), but for DRS. (D) Pie chart depicting the proportions of gene biotypes of all mapped genes from the reference genome (Ensembl release 105, GRCh38) mapped PCS and DRS reads of sequenced tumor samples. (E) Venn diagram showing the overlap between PCS and DRS mapped genes. (F) Correlation between gene expression levels (Log10 reads per million [RPM]) of all genes mapped by both PCS and DRS (n = 25,692). Diagonal line represents the line of best fit. R2 value was computed to measure goodness-of-fit and P-value was generated from F-test, with P < 0.05 considered statistically significant. Lowest expression values shown correspond to the minimum normalized abundance derived for genes detected only at one read in the sample with the highest total number of reads.


