
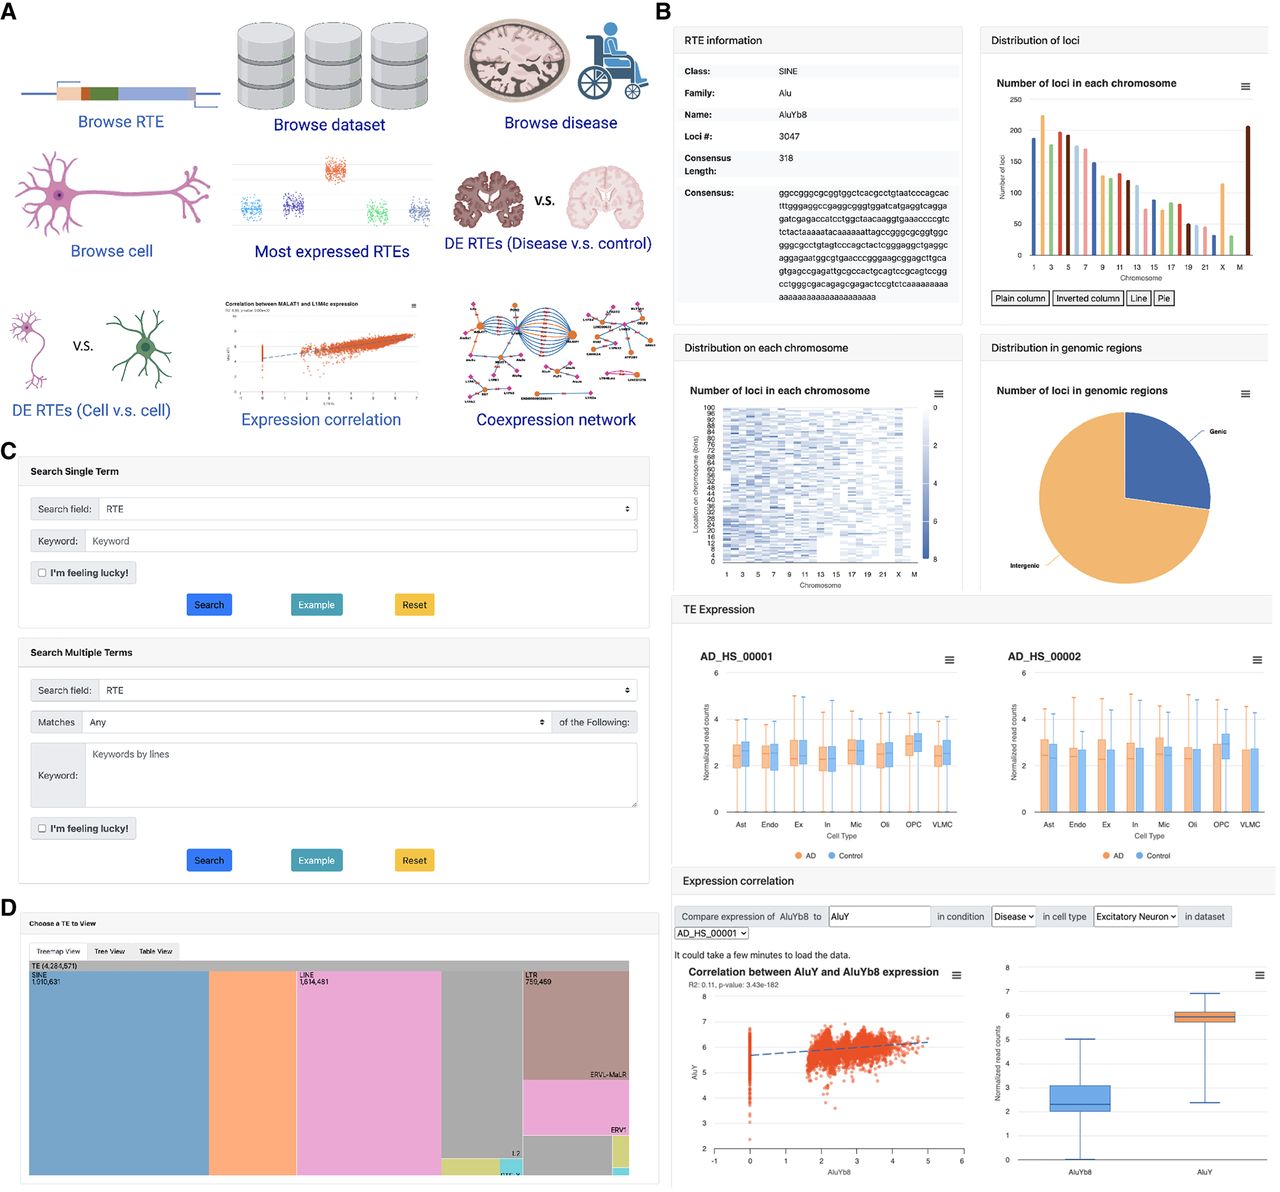
scARE for exploration of RTE information and heterogeneity in three neurodegenerative diseases. (A) The home page of scARE displays prompt access to the major functions. (B) RTE view of the scARE. It contains seven major components: basic information, distribution of loci across chromosomes, distribution of loci within each chromosome, distribution of loci in different genomic regions, mean expression across data sets, and analytical module of expression correlation. (C) The search page of the scARE. Users can search for RTEs by using single or multiple terms in the fields of RTE, gene, data set, and disease. (D) Browse by RTE options. Four different options to browse RTEs by “RTE,” “cell type,” “disease,” and “data set.”


