
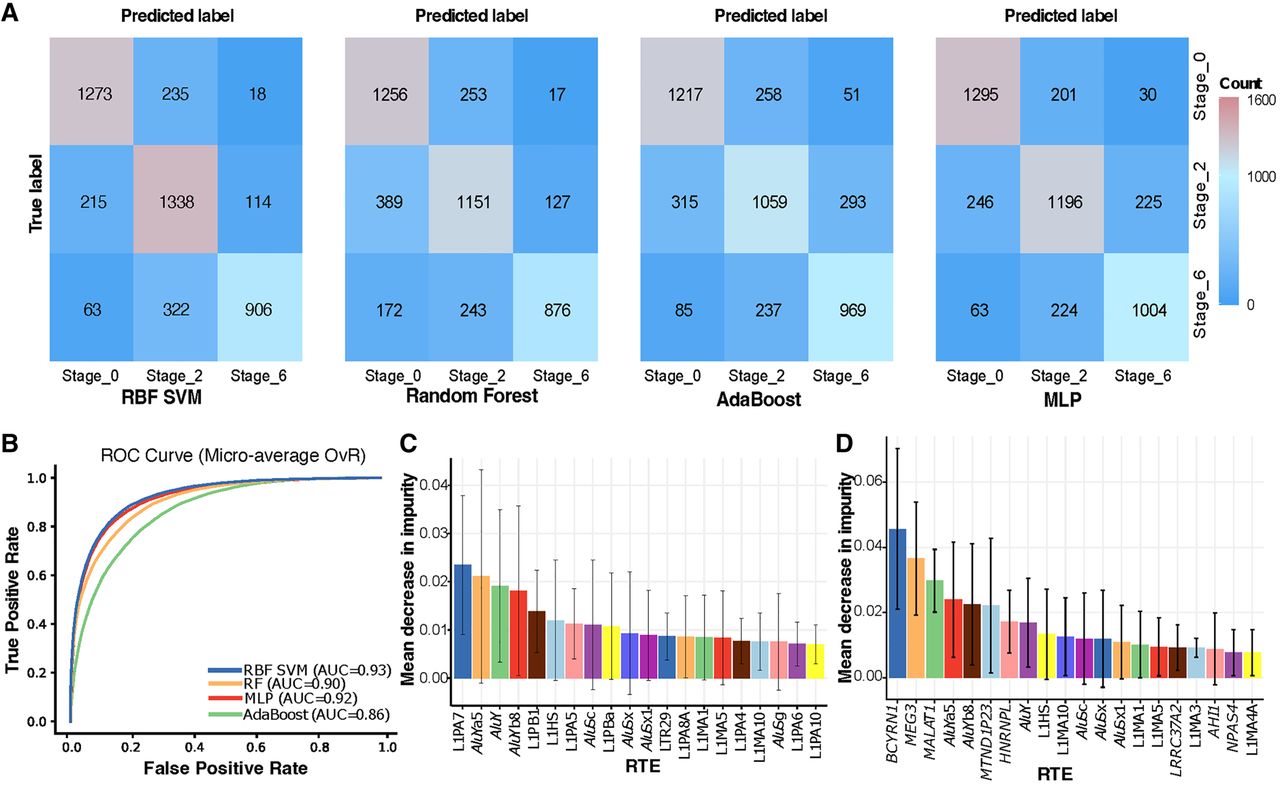
RTE expression profile predicts the disease stage using machine learning algorithms. (A) Confusion matrix for predicting the disease-stage label of excitatory neurons using RTE expression profile by radial basis function kernel support vector machine (RBF SVM), random forest (RF), adaptive boosting (AdaBoost), and multiple layer perceptron (MLP). (B) Tenfold cross-validation receiver operating characteristic (ROC) curve for predicting the disease-stage label of excitatory neurons using RTE expression profile by RBF SVM, RF, MLP, and AdaBoost. (C) Feature importance extracted from the RF model in A. (D) Feature importance extracted from the RF model built with a combination of RTE and gene expression selected by recursive feature elimination (RFE). Only excitatory neurons were considered in this figure.


