
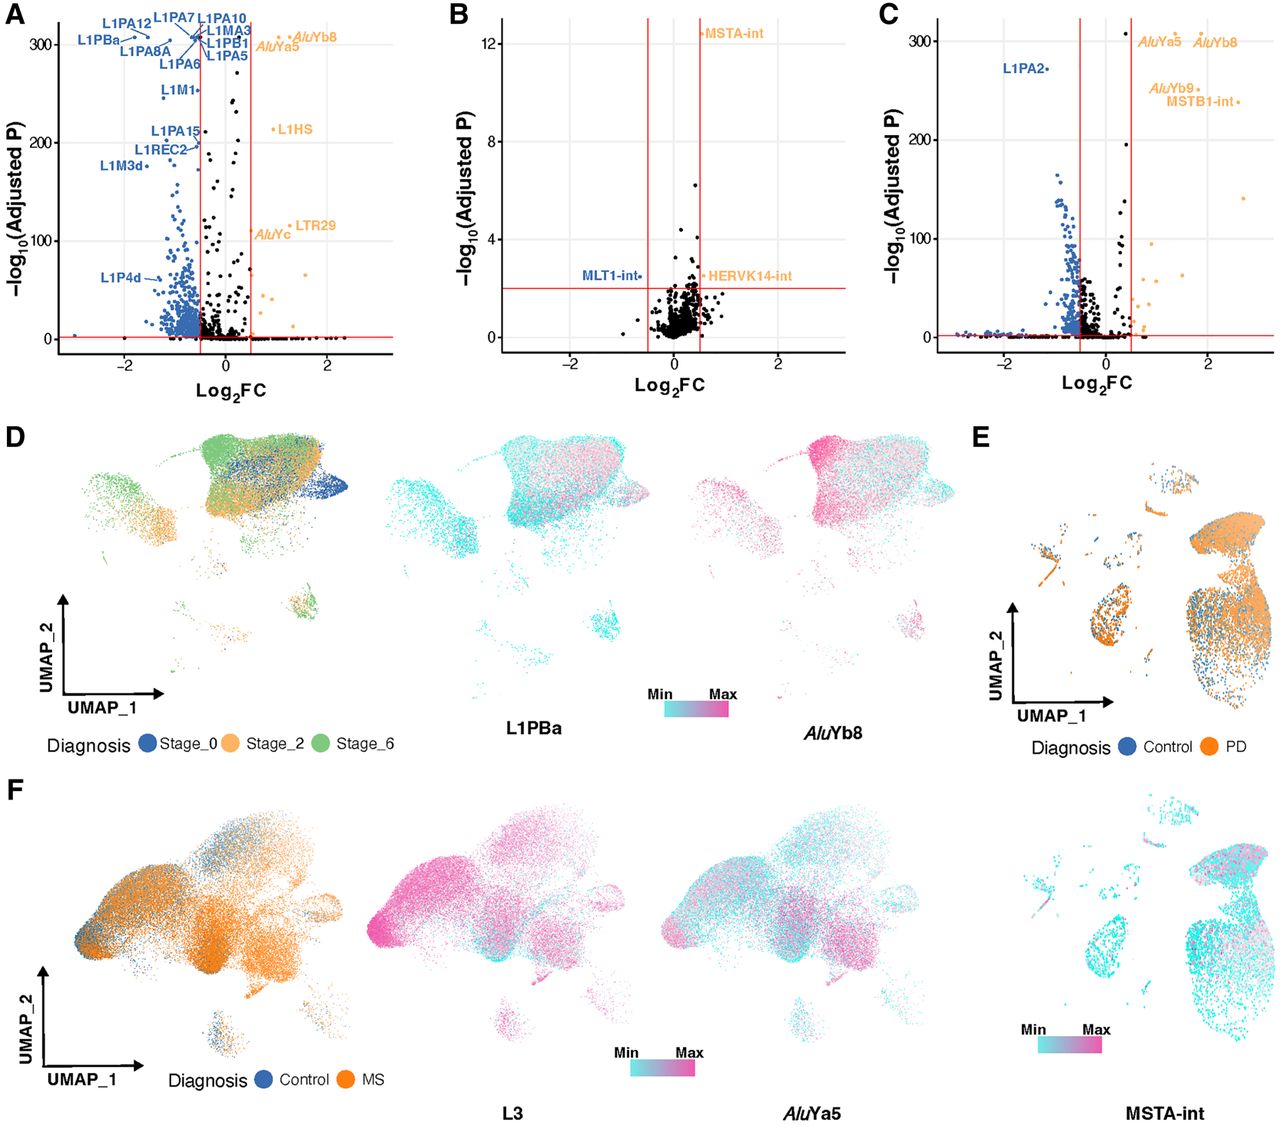
Figure 4.
RTEs are dynamically regulated in neurodegenerative diseases. (A–C) Volcano plots showing differentially expressed RTEs in excitatory neurons of three diseases—(A) AD, (B) PD, and (C) MS—versus their matched normal condition. (D) L1PBa expression decreases as AD progressed, whereas AluYb8 expression shows the opposite trend. (E) MSTA-int shows higher expression in the neurons of the PD brain. (F) L3 has lower expression in neurons from the MS brain, and AluYa5 displays the opposite trend.


