
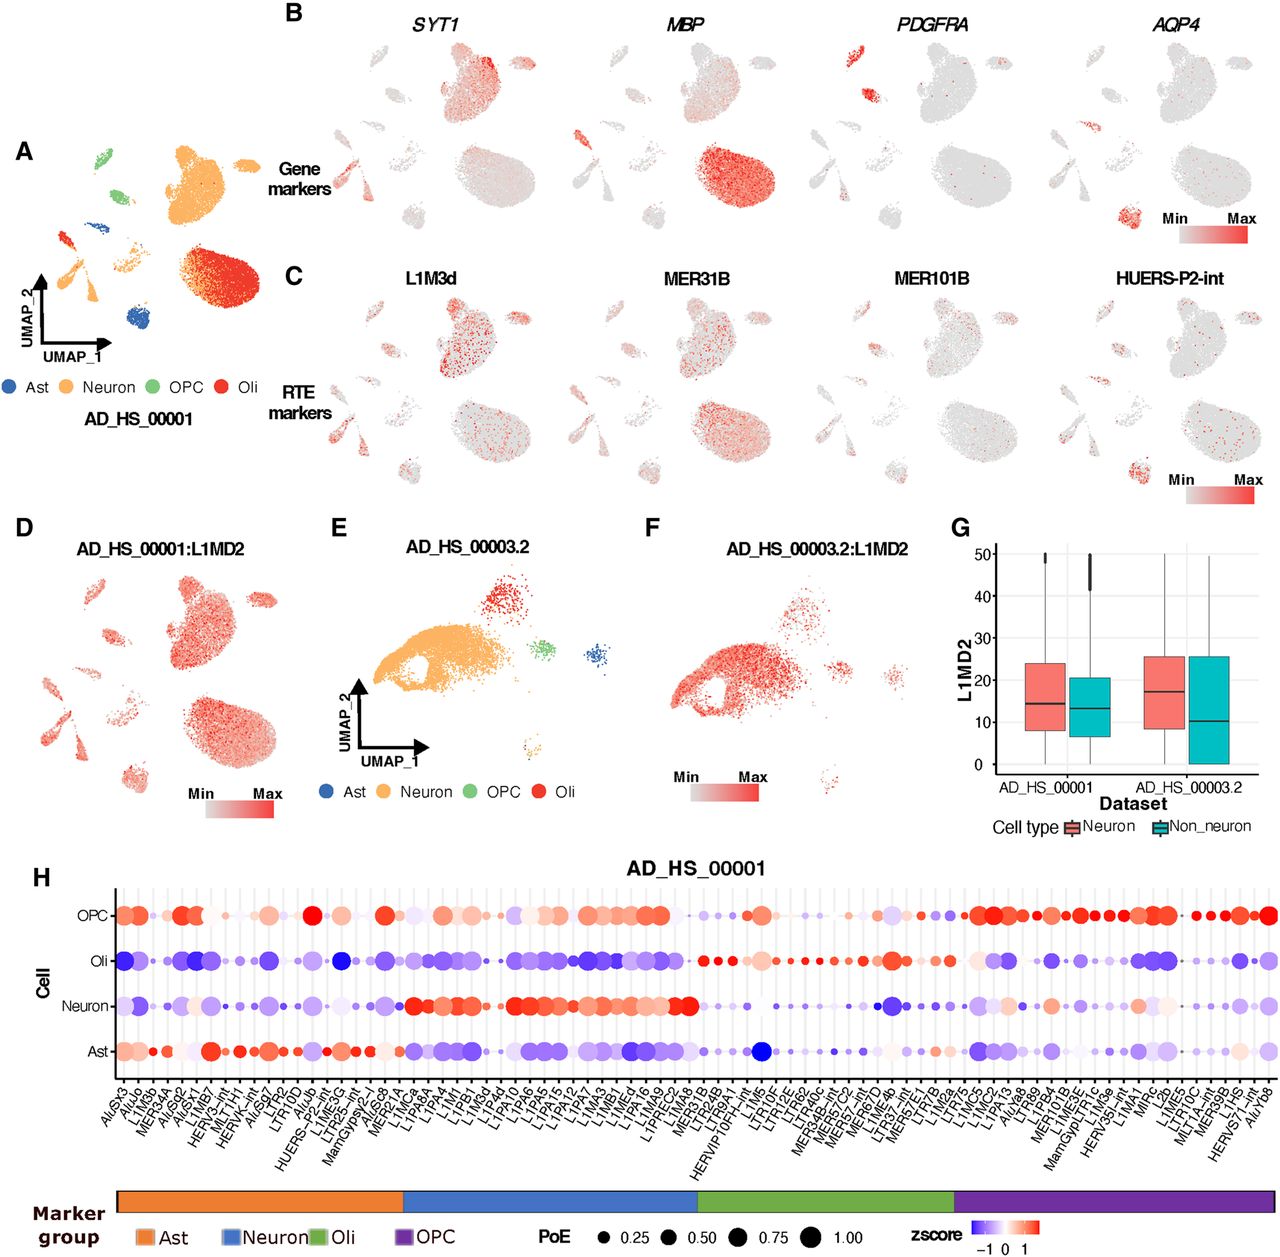
Cellular heterogeneity of RTEs. (A) Uniform manifold approximation and projection (UMAP) plot of cells in normal patients in data set AD_HS_00001 colored by cell type. Excitatory and inhibitory neurons were combined as neurons. (Ast) Astrocytes, (Oli) oligodendrocytes, (OPC) oligodendrocyte precursor cells. (B) Examples of well-known gene markers of neurons, Oli, OPCs, and Ast. Colors represent the expression of genes in the corresponding cell types. (C) RTE markers identified in this study for neurons, Oli, OPCs, and Ast. (D) Expression of L1MD2 in AD_HS_00001. (E) UMAP of cells in normal individuals in data set AD_HS_00003.2, colored by cell type. (F) Expression of L1MD2 in data set AD_HS_00003.2. (G) Boxplot of expression of L1MD2 in data sets AD_HS_00001 and AD_HS_00003.2. Color represents cell type (neurons vs. nonneurons). (H) Dot plot showing signature RTE expression and percentage of cells for neurons, OPCs, Oli, and Ast in the data set AD_HS_00001.


