
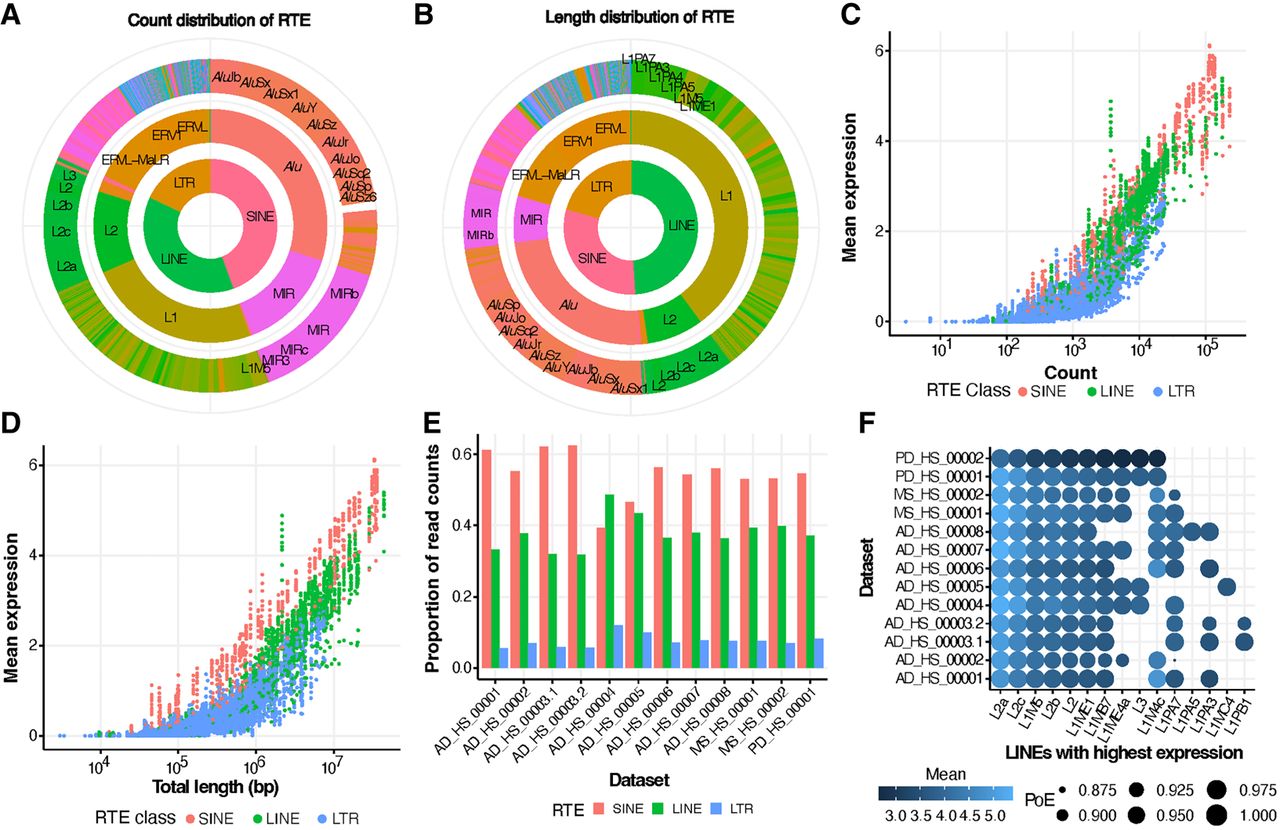
Landscape of RTE expression. (A) Proportion of copy number of each RTE class (inner circle), family (middle circle), and subfamily (outer circle). (B) Proportion of the sequences of each RTE class (inner circle), family (middle circle), and subfamily (outer circle) in the human genome. (C) Correlation between mean expression of RTE subfamilies across all data sets and their copy number, colored by the RTE class. (D) Correlation between the mean expression of RTE subfamilies across all data sets and their total length, colored by the RTE class. (E) Proportion of RTE reads mapped to short interspersed nuclear element (SINE), long interspersed nuclear element (LINE), and long terminal repeat (LTR) families in each data set. (F) RTE subfamilies with the highest expression levels in the LINE class. The size of the circle indicates the percentage of cells expressing RTE. The extent of color reflects the mean expression across all cells in each data set.


