
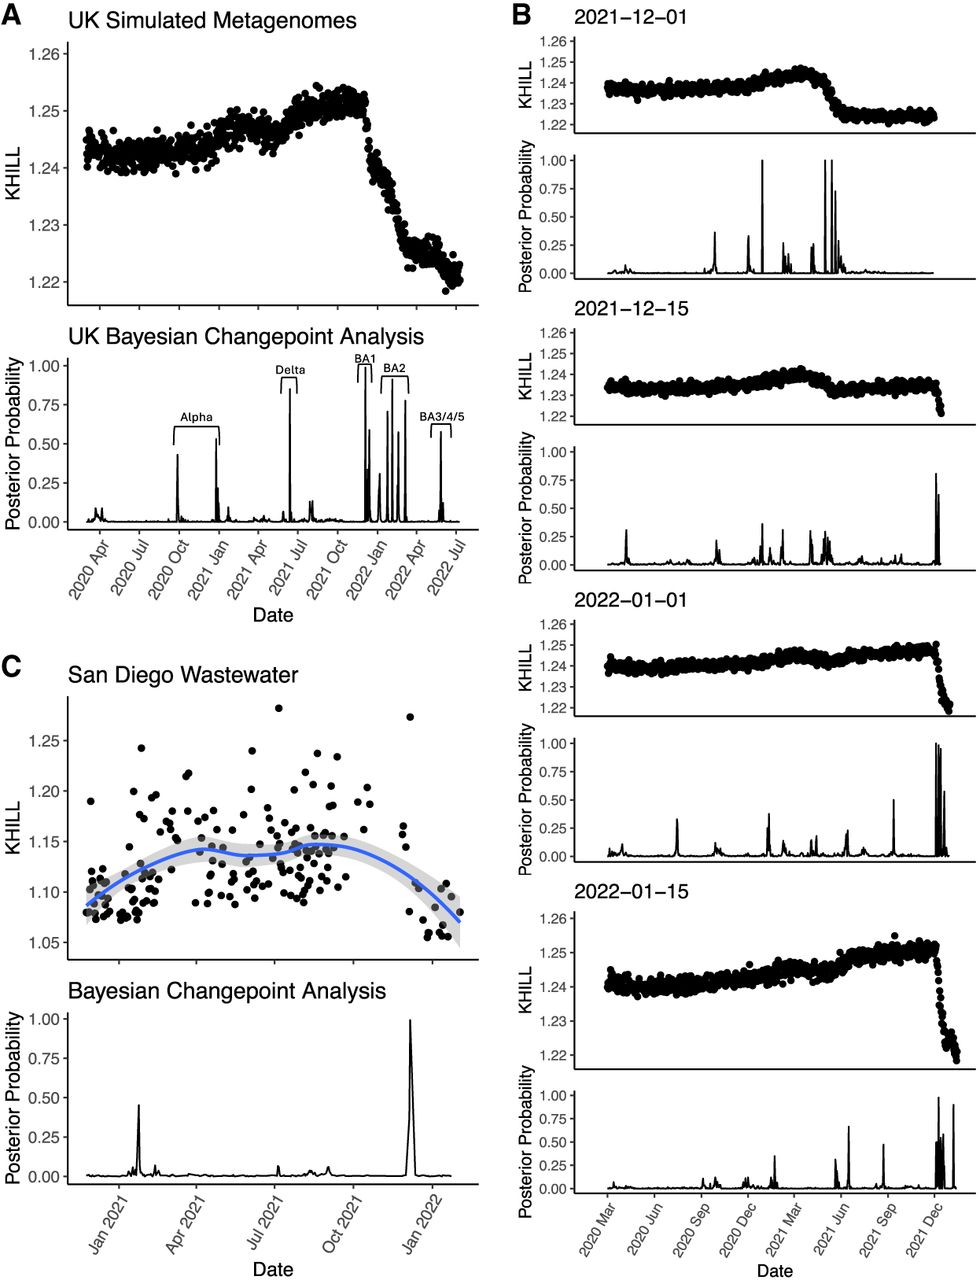
SARS-CoV-2 in raw, pooled sequence. We show pairwise comparisons of the simulated survey sequence from July 11, 2022 to the simulated survey sequence from all prior days during the course of the UK pandemic. This autocorrelation analysis shows a pronounced downward swing marking the turnover from Delta to Omicron. The shadows of previous transitions are also evident in the KHILL trace. We show that these transitions are significant using Bayesian Changepoint Detection and annotate each transition with its emerging variant (A). To demonstrate how this technique can be used in real time, we compare simulated survey sequence from four-time points chosen to track the arrival of Omicron. As Omicron suffuses the population, we can see the KHILL curve plunge with respect to time points dominated by Delta (B). San Diego wastewater data show similar—albeit noisier—transitions between variants. Comparison of raw sequence from a day dominated by Omicron to all prior days shows clear and significant separation between Alpha/Epsilon and Delta/Omicron (C).


