
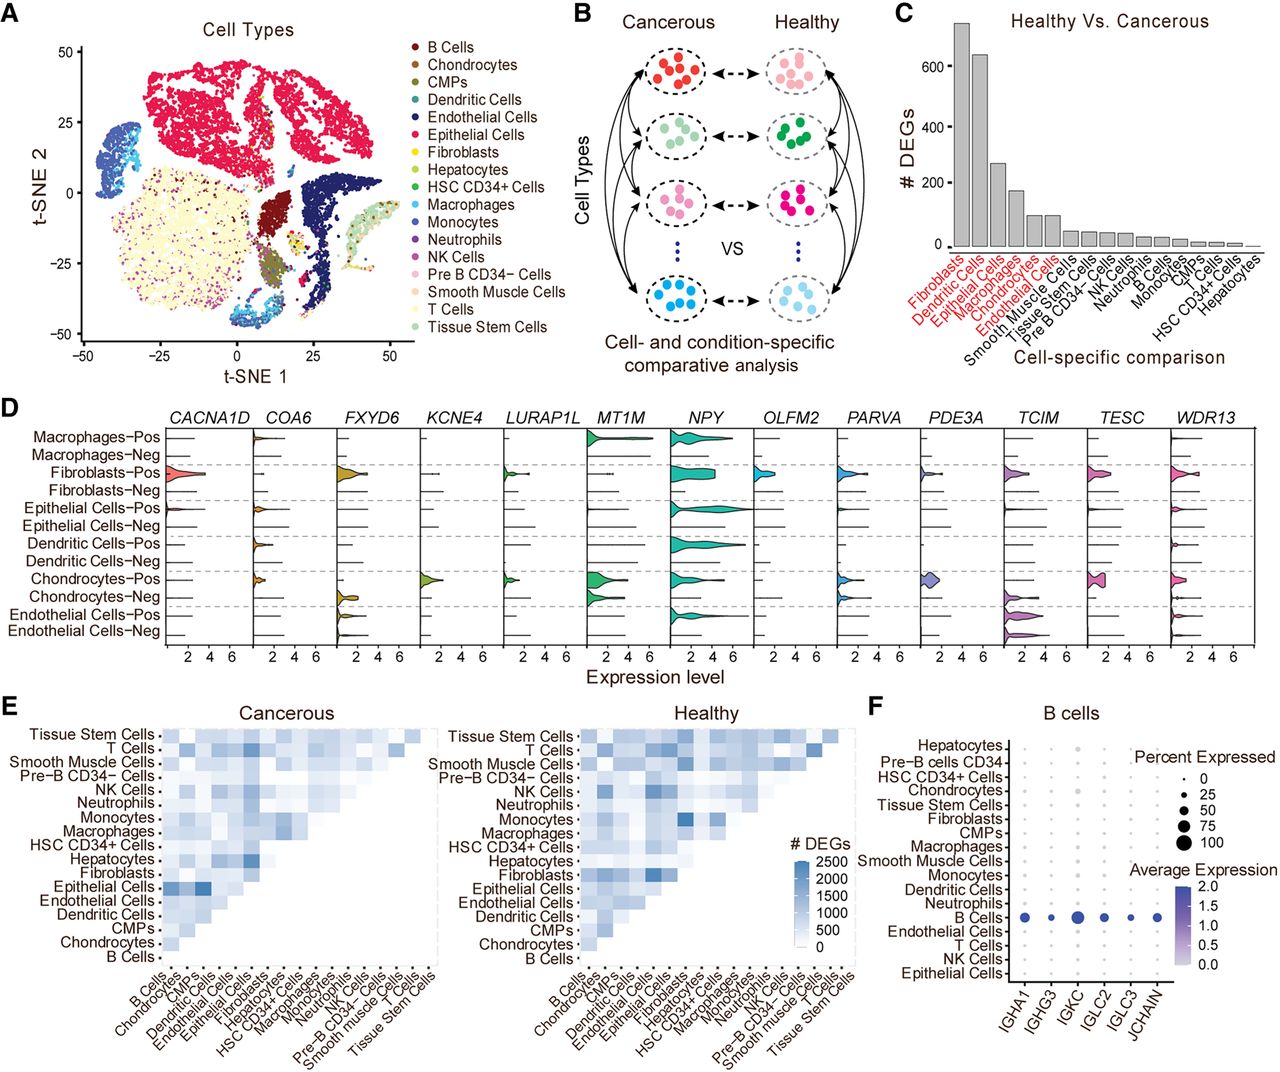
Figure 4.
DEGage detects canonical prostate cancer markers across multiple cell types. (A) t-SNE embeddings of 24,926 human prostate cancer cells. (B) Organization of analyses with DEGage on the Heidegger data set. (C) The number of DEGs detected between cancerous and healthy conditions of the same cell type. The HVCTs are indicated in red. (D) Prostate cancer marker genes detected by DEGage in HVCTs. Expression levels of each gene are shown for both cancerous and healthy conditions of each cell type. (E) The number of DEGs detected between each cell type under cancerous and healthy conditions, respectively. (F) Marker genes detected by DEGage in healthy B cells.


