
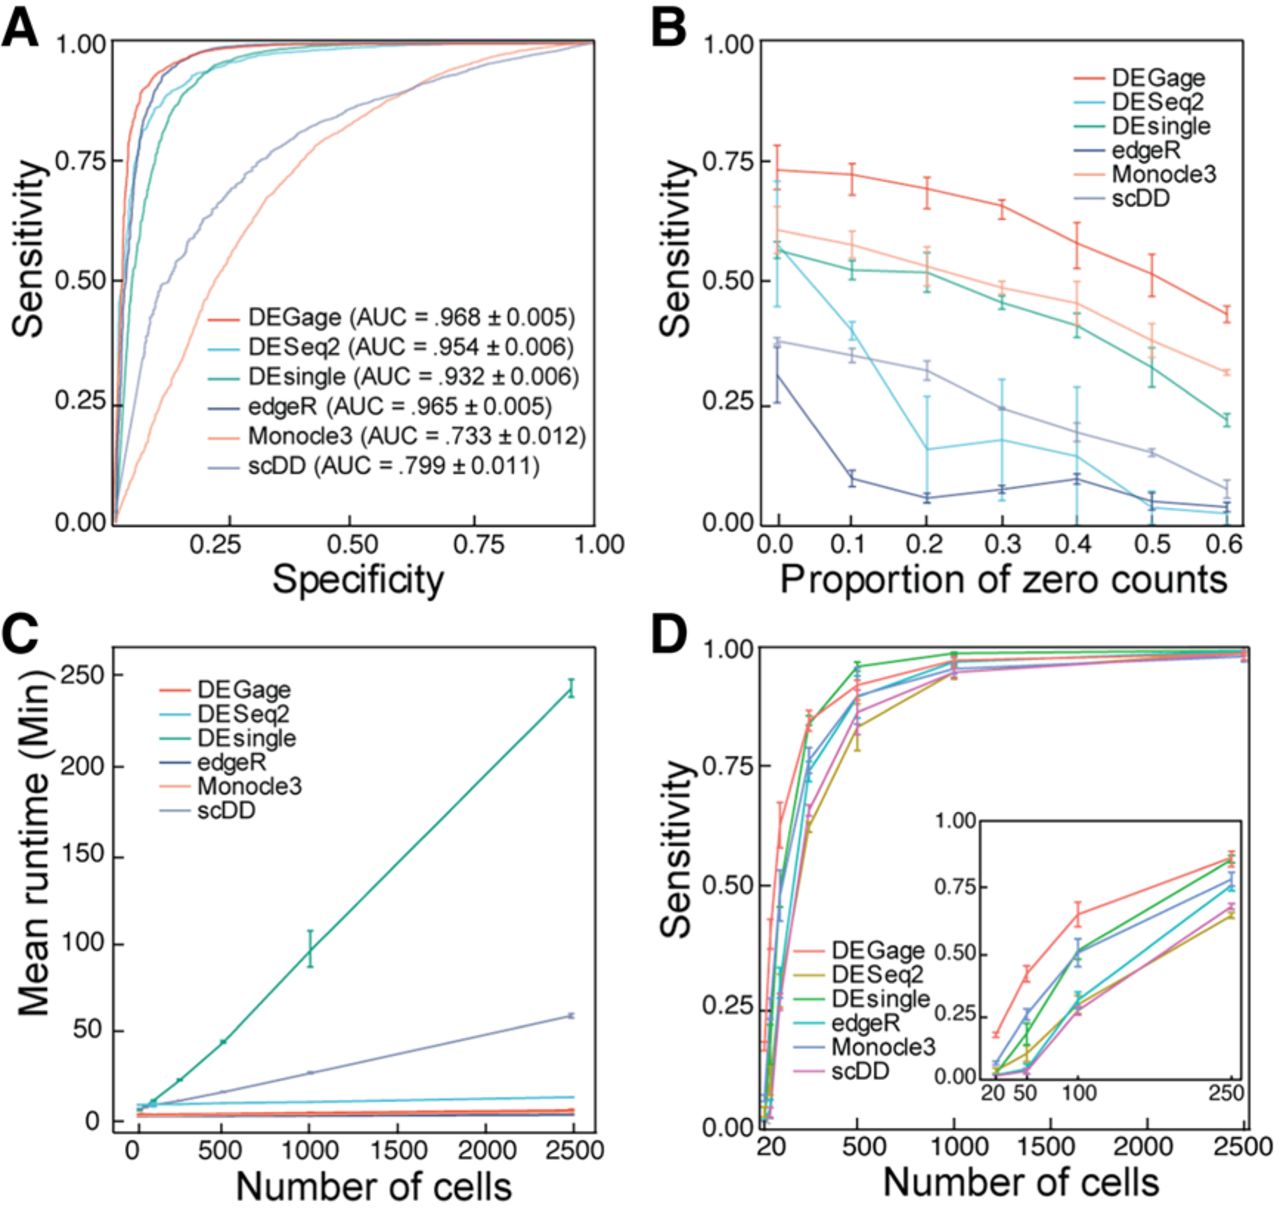
Figure 2.
Computational performance of DEGage. (A) ROCs show the performances of six methods on simulated data. (B) The effect of dropout proportions on the sensitivities of the six methods. (C) Runtimes of each method with varying numbers of cells. (D) Sensitivities of each method with different numbers of cells.


