
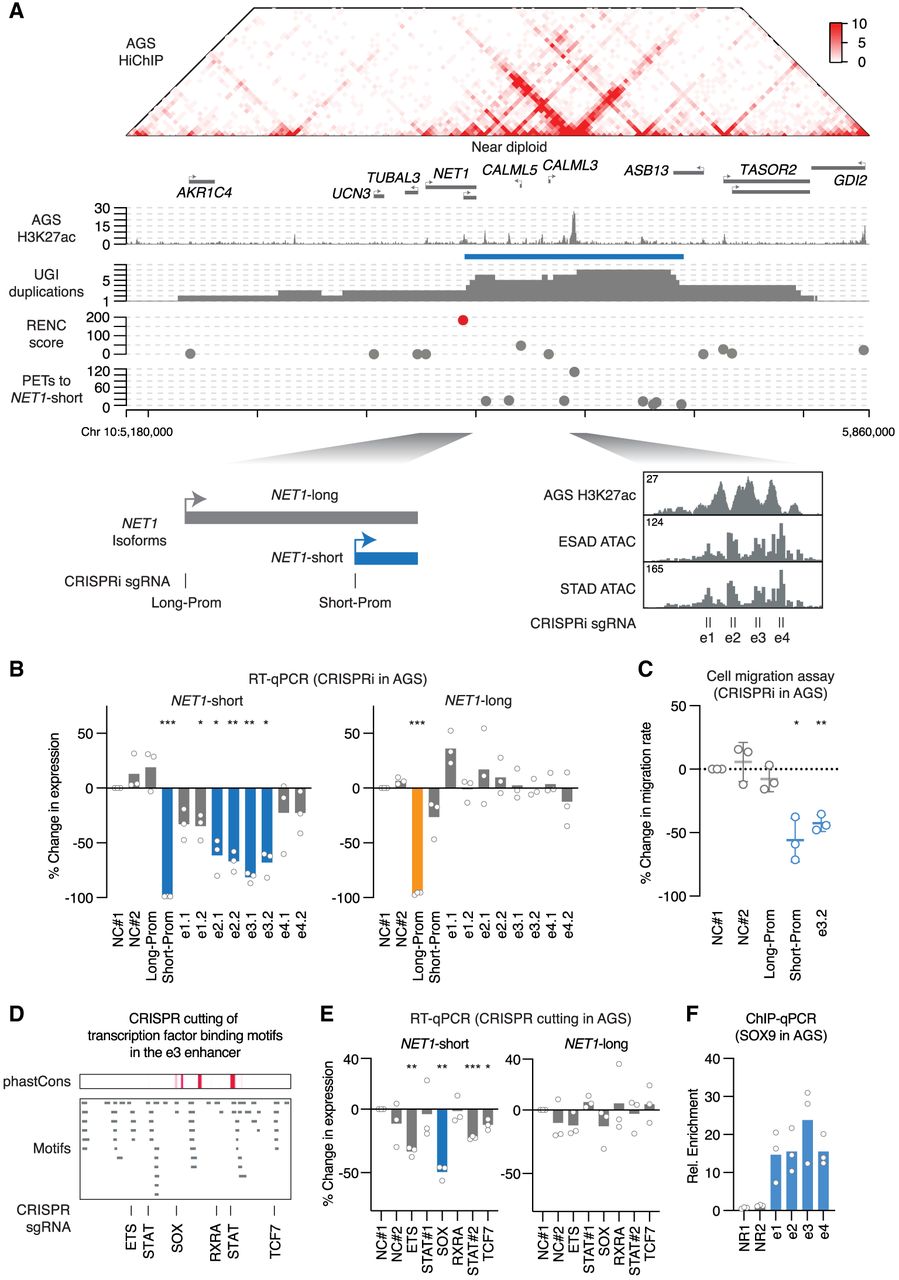
Functional dissection of a duplication hotspot at the NET1 locus. (A) Presented tracks are H3K27ac HiChIP and H3K27ac ChIP-seq signal from the AGS cells, the position of the identified duplication hotspot, and the duplication events observed in UGI cancer. The RENC methodology prioritized NET1-short as the target gene isoform of the enhancers within the duplication hotspot, and also identified a cluster of four individual enhancers as the main driver for NET1-short transcriptional activation. TCGA ATAC-seq signal at the highlighted region containing the e1–e4 enhancers is presented. (B) RT-qPCR results showing expression changes of NET1-short and NET1-long isoforms after CRISPRi of the enhancers e1–e4 in AGS cells (n = 3 biological replicates). sgRNAs (NC#1 and NC#2) with no recognition sites in the genome serve as negative controls. sgRNAs targeting the promoters of NET1-short and NET1-long serve as positive controls. P-values were derived from two-sided t-tests: (*) P < 0.05, (**) P < 0.01, (***) P < 0.001. (C) Cell migration rate changes of AGS cells after CRISPRi of the NET1-short promoter, the NET1-long promoter, or the e3 enhancer (n = 3 biological replicates). P-values were derived from two-sided t-tests: (*) P < 0.05, (**) P < 0.01. (D, top) phastCons score (0:1 range) representing the conservation level of the DNA sequences in the e3 enhancer; (middle) distribution of JASPAR transcription factor-binding motifs identified in the e3 enhancer; (bottom) CRISPR cutting positions and the disrupted DNA motifs. (E) RT-qPCR results showing expression changes of NET1-short and NET1-long isoforms after CRISPR cutting of the annotated motifs (n = 3 biological replicates). P-values were derived from two-sided t-tests: (*) P < 0.05, (**) P < 0.01, (***) P < 0.001. (F) SOX9 ChIP-qPCR results showing the binding of SOX9 at the enhancers e1–e4 (n = 3 biological replicates) in AGS cells. NR1 and NR2 are two negative control regions. The ChIP-qPCR signal was normalized to the sonicated genomic input and then normalized to the averaged signal of NR1 and NR2.


