
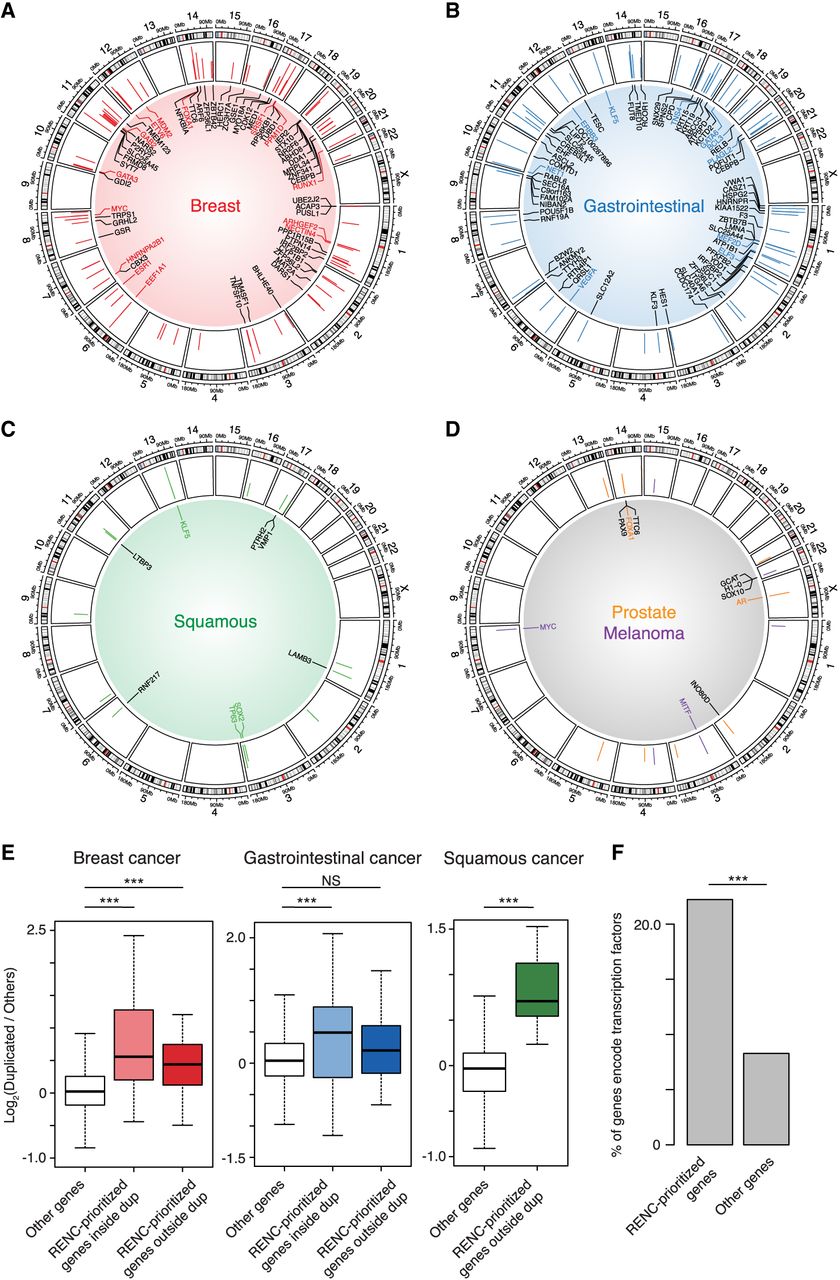
Comprehensive identification of target genes for the duplicated enhancers. (A–D) circlize plots presenting the genomic positions of the identified duplication hotspots, their duplication occurrences (scale: 0 to ≥10), and the associated target genes based on the RENC analysis in breast cancer (A), UGI cancer (B), squamous cancer (C), melanoma, and prostate cancer (D). For UGI cancer, due to the space limitation, presented are hotspots supported by duplications from more than five samples (the remaining hotspots were presented in Supplemental Fig. S3D). The colored genes indicate the previously annotated oncogenes (Chakravarty et al. 2017; Liu et al. 2017; Sondka et al. 2018). (E) Expression fold change (log2-transformed) of RENC-prioritized target genes for the duplication hotspots in samples with the associated duplications versus the ones without duplications or deletions of the hotspot regions in breast, UGI, and squamous cancers. RENC-prioritized genes inside dup: RENC-prioritized target genes that are within the duplication hotspots; RENC-prioritized genes outside dup: RENC-prioritized target genes that are outside of the duplication hotspots; Other genes: genes that are not prioritized for the duplication hotspots based on RENC analysis, which are used as negative controls. For the “other genes,” expression fold changes between samples with duplications of any hotspot versus the ones without duplications or deletions of these hotspots were calculated. P-values were derived from two-sided Wilcoxon tests: (***) P < 0.001, (NS) not significant. (F) The percentage of RENC-prioritized target genes that encode transcription factors, as compared to that of all the other protein-coding genes. P-value was derived from a Fisher's exact test: (***) P < 0.001.


