
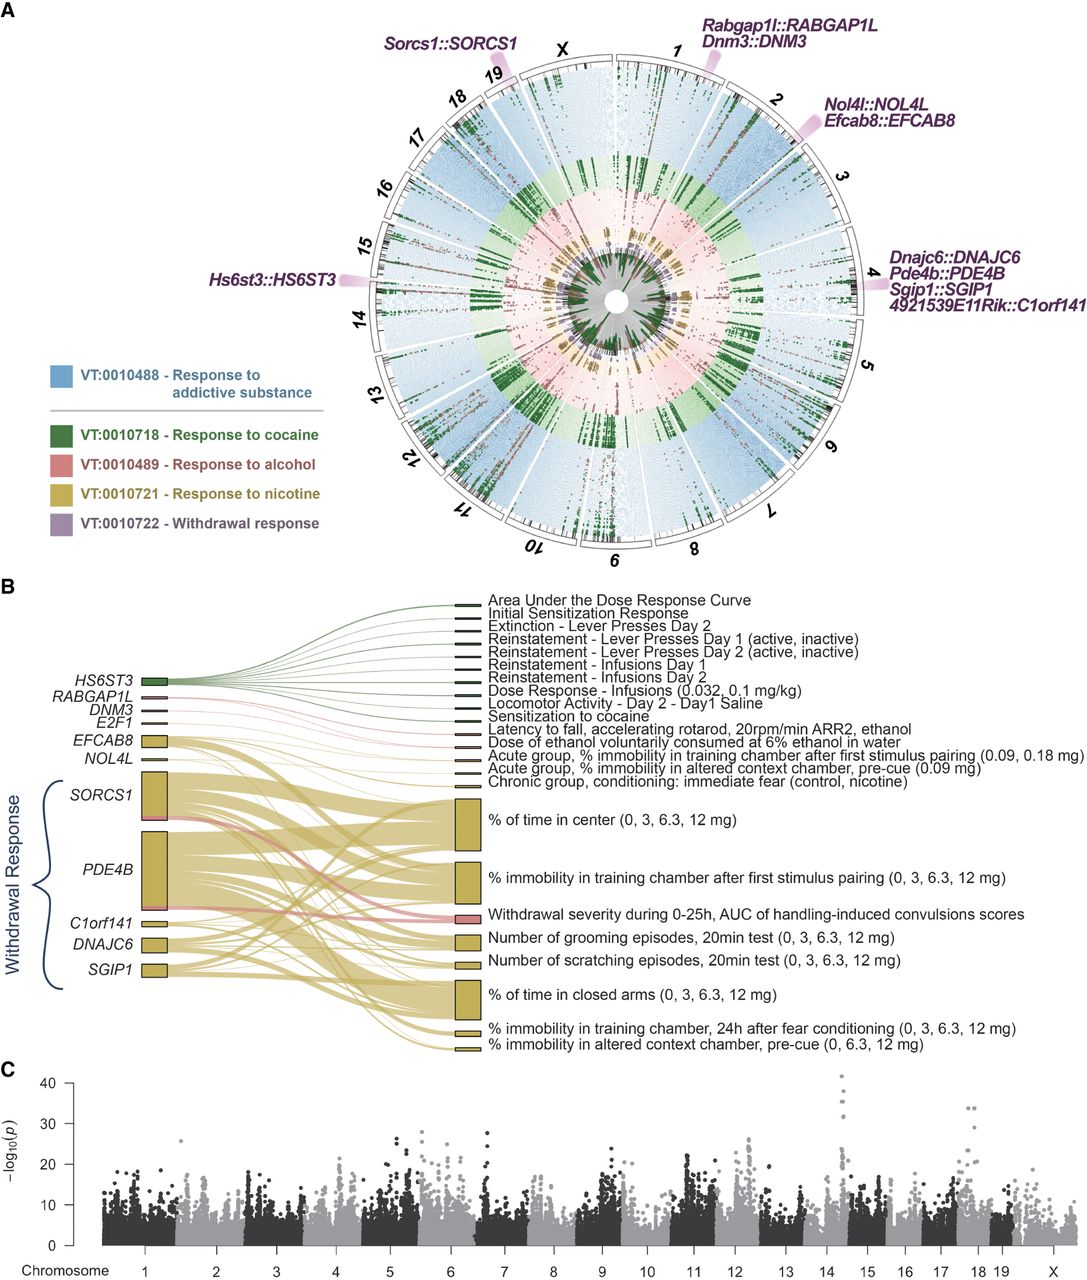
Cross-species integration of human multisubstance GWAS with mouse cross-population multitrait meta-analyses of 360 or more traits grouped by vertebrate trait (VT) ontology term. (A) The circular plot provides a bird's eye view of these five mouse meta-analyses, variant effects, and associated pleiotropic genes detected in both mouse and human GWASs across multiple substances (Hatoum et al. 2023). Genomic regions of variants associated to these genes are highlighted, with associated mouse genes and their human orthologs annotated along the outer ring. The colors of each ring correspond to separate meta-analyses for response to addictive substance (blue), cocaine (green), alcohol (red), nicotine (orange), and withdrawal response to addictive substance (purple). Dots, colored by substance, indicate measures in which the variant effect exists (m-value > 0.9) (Han and Eskin 2011) to enable discernment between substance-specific effects and polysubstance effects. A full resolution version with annotations of all associated mouse genes is available (Supplemental Fig. S4). (B) The Sankey plot shows the number of variants affecting the mouse traits and the associated orthologous genes. The width of the line represents the number of variants, and the color of the line represents the substance (green indicates cocaine; red, alcohol; orange, nicotine). (C) The Manhattan plot of the meta-analysis of the parent term, response to addictive substance (VT: 0010488) on 366 mouse traits.


