
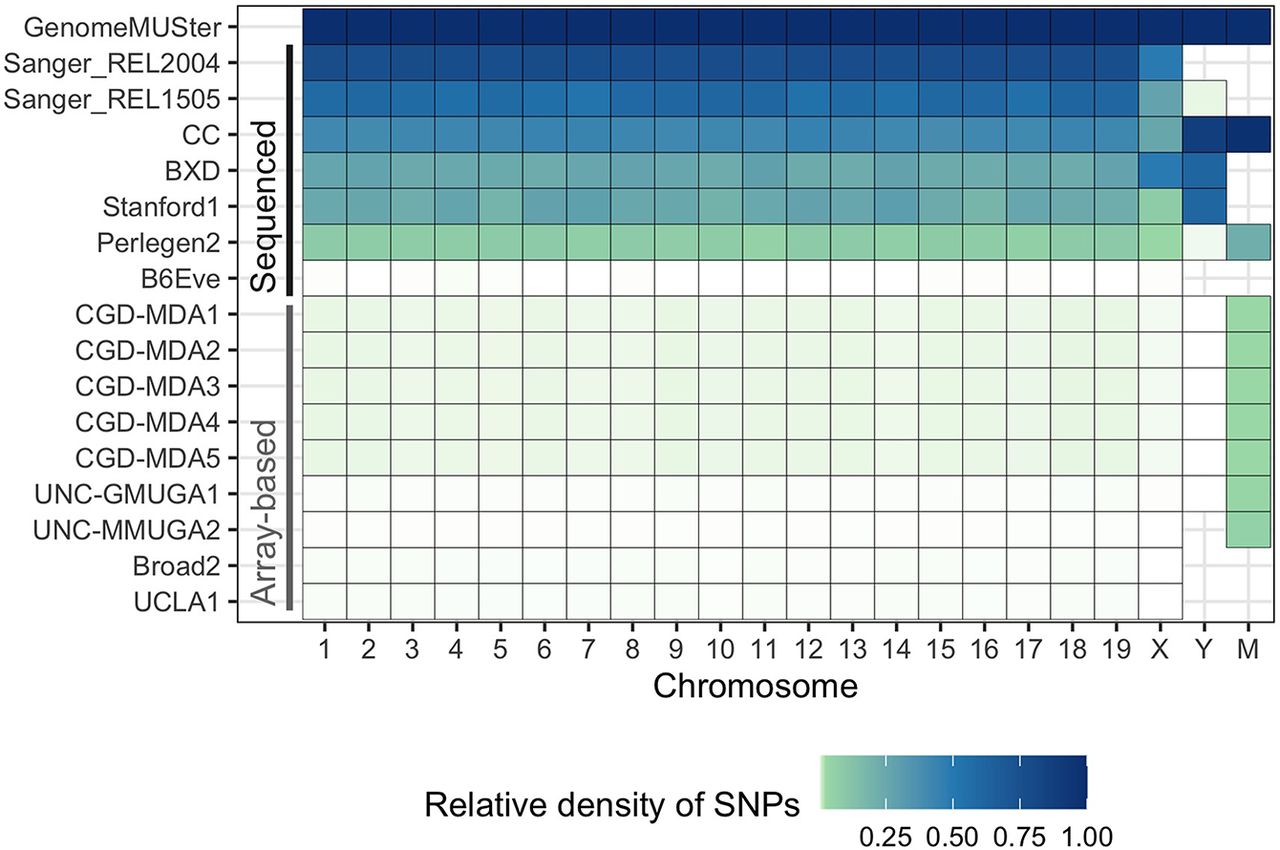
Relative density of information in each data set to GenomeMUSter. The intensity of the color represents the density of SNPs for each data set and chromosome, with white, light green, and dark blue representing a density near 0, less than 0.25, and 1, respectively. Whole-genome sequencing data sets (labeled “sequenced”) include two Sanger variant sets, collaborative cross (CC), BXD recombinant inbred strains, long-read whole-genome sequencing data set of classical inbred strains (Arslan et al. 2023), Perlegen2, and B6Eve; that is, C57BL/6J Eve. The relative density of the B6Eve data set is low because it only includes allelic states that differ from the reference, C57BL/6J. All other variant sets are array-based.


