
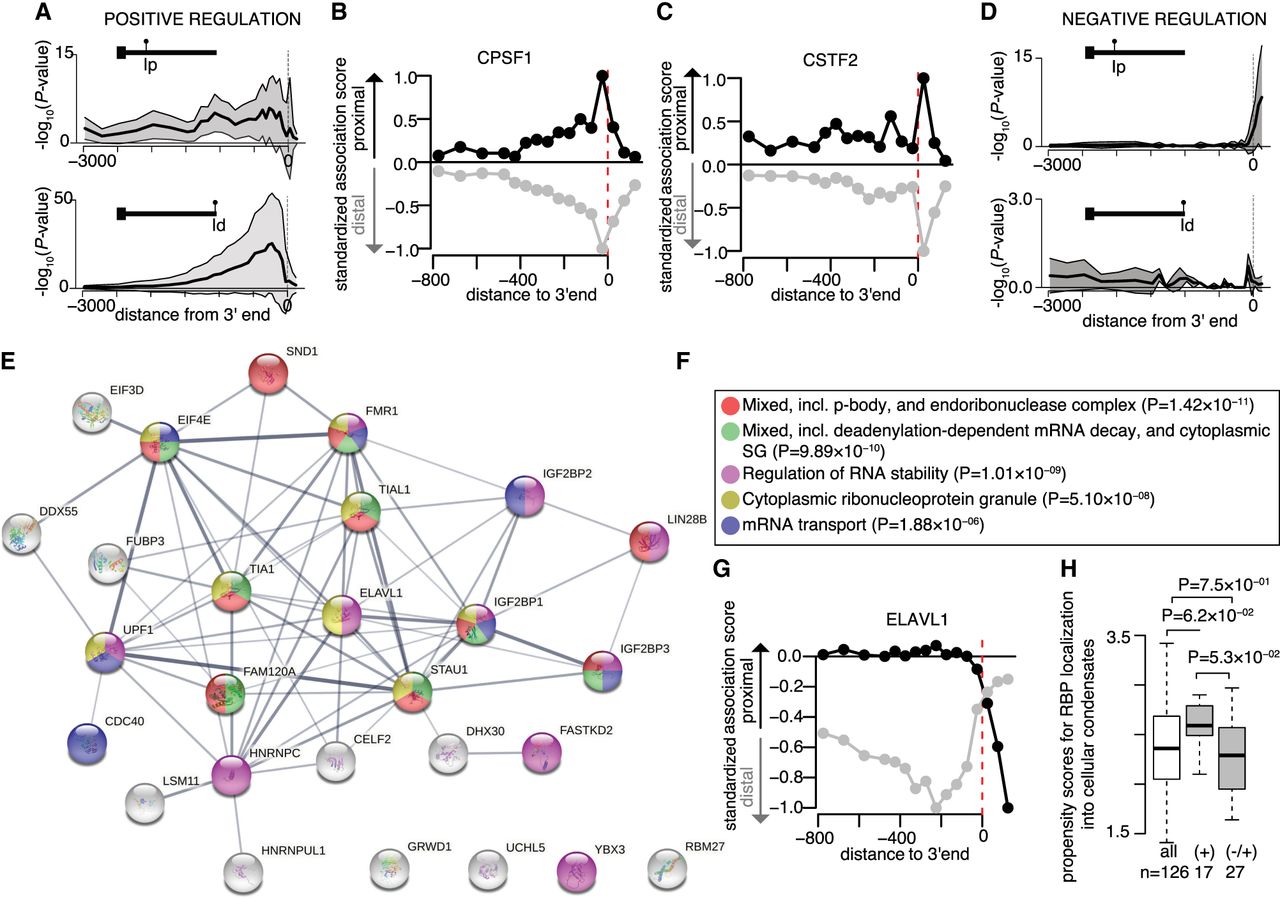
Predicted RBP regulome underlying alternative polyadenylation (APA). (A) Distribution of significant positive association between the binding of 126 RBPs in defined regions along the 3′ UTR and the relative usage of the promoter-proximal (top) or promoter-distal (bottom) 3′ UTR isoform. Dark lines display the median significance; shaded areas, lower and upper quartiles. (B,C) Scatterplot of the extent of standardized significant association between CPSF1 (B) or CSTF2 (C) cross-link events in defined regions along the 3′ UTR and the relative usage of the promoter-proximal (black) or promoter-distal (gray) 3′ UTR isoform in the axons. (D) Negative association between RBP binding and the relative usage of the promoter-proximal (top) or promoter-distal (bottom) 3′ UTR isoform. (E) Network of protein–protein interactions for 27 candidate regulators of APA predicted to prevent promoter-proximal usage when bound to the [0:150]-nt region downstream from the 3′ end. Edges represent experimentally determined protein–protein interactions annotated in the STRING database (Szklarczyk et al. 2017). Nodes indicate proteins colored according to the biological pathways they are enriched in. (F) Top five biological pathways and associated P-values overrepresented in the 27 candidate negative regulators of short 3′ UTR isoform. Fisher's enrichment test. (G) Same as B,C for ELAVL1. (H) Distributions of the propensity scores of the 126 RBPs, the 17 positive regulators of APA (short and long 3′ UTR isoform), and the 27 negative regulators of the short 3′ UTR isoform to localize into cellular condensates as predicted by GraPES (Kuechler et al. 2022). Welch's t-test assessing the significant difference between the mean propensity scores.


