
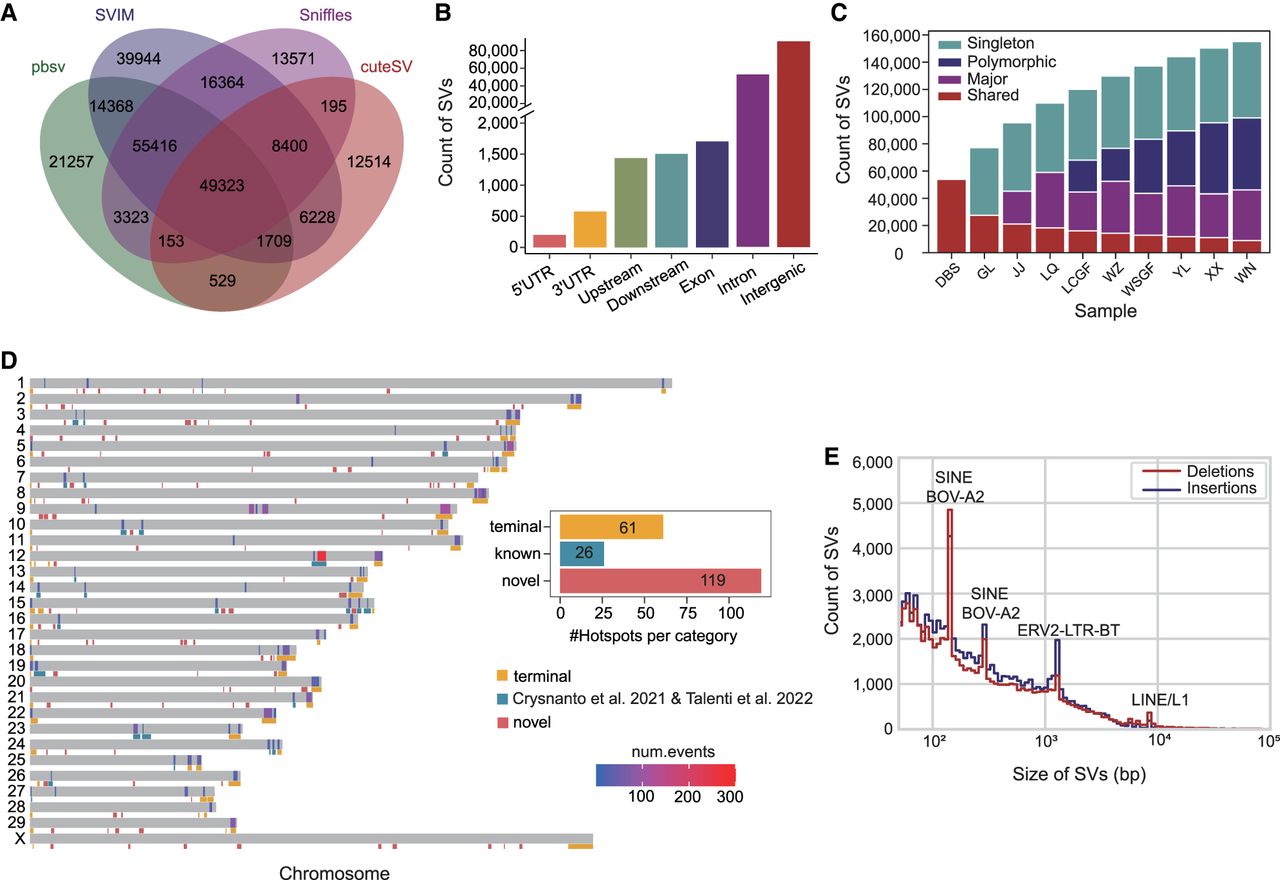
Discovery and distribution of structural variation in 10 Chinese indicine. (A) Venn diagrams show the total number of SVs in the Chinese indicine population identified by pbsv, Sniffles, cuteSV, and SVIM software and their overlap. (B) The numbers of SVs overlapping with different genomic features. (C) The number of variants in each discovery class is shown per sample. The SVs can be classified into four classes: shared, major, polymorphic, and singleton. (D) Genome-wide distribution of SV hotspots detected from previously published SV data sets by Crysnanto et al. (2021) and Talenti et al. (2022) (blue to red heatmap). SV hotspots identified in this study were divided into three groups: “terminal,” the last 5 Mb of chromosome end (yellow); “known,” overlapping with published data (blue); and “novel,” unique for this study (red). The bar plot (inset) shows the total of the number of hotspots in each group. (E) The length distribution of deletions and insertions. Expected two SINE BOV-A2, LTR, and LINE-1 mobile element insertion peaks are marked at ∼145 bp, 285 bp, 1.3 kb, and 8.5 kb, respectively.


