
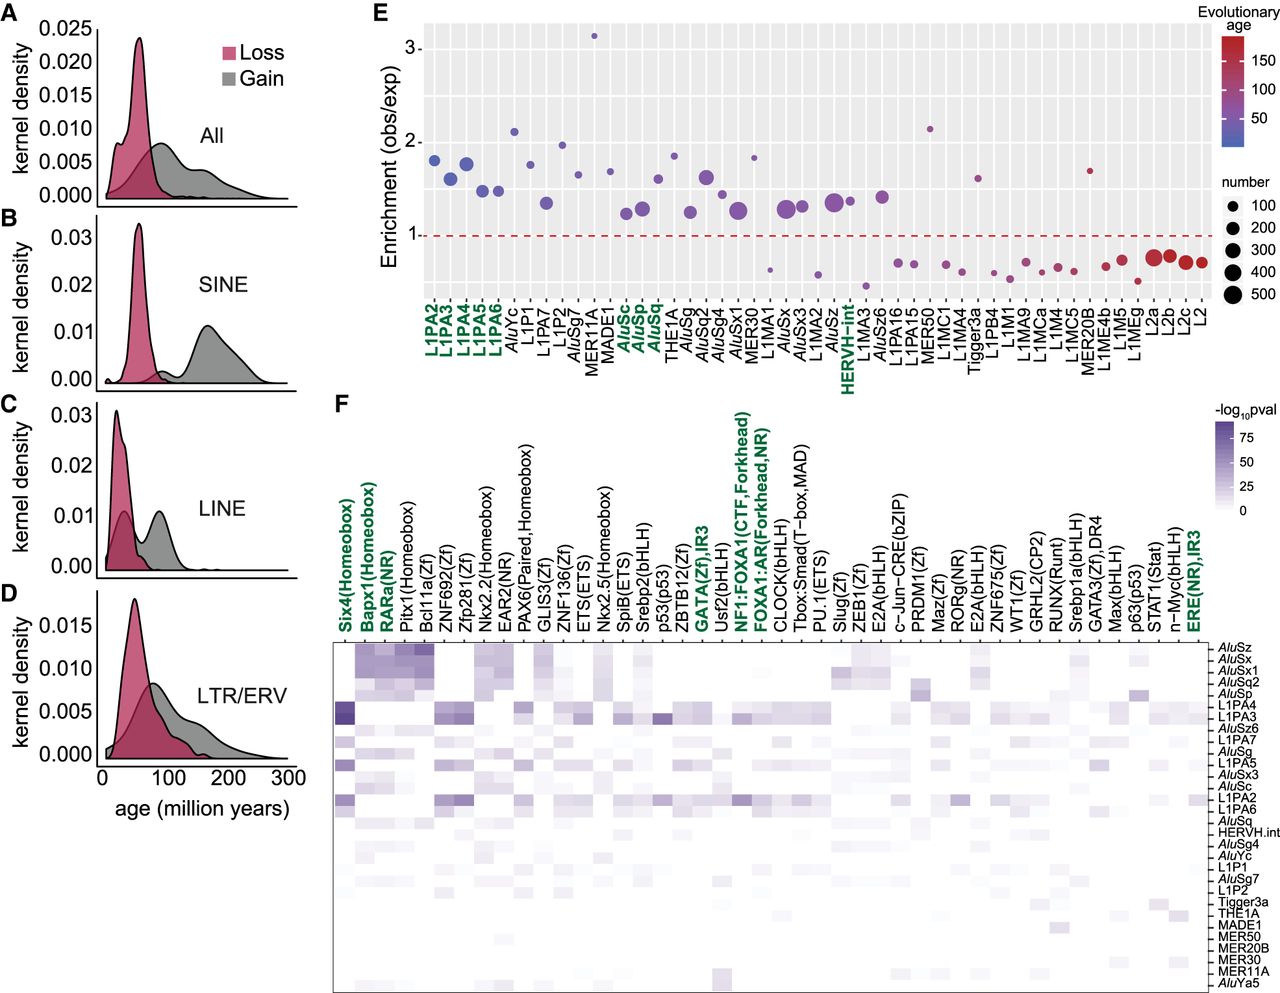
Evolutionarily recent TEs show variable methylation loss with age. (A–D) Evolutionary age of all TE (A), SINE (B), LINE (C), and LTR/ERV (D) elements that are variably methylated with methylation loss or gain. Evolutionary ages of only the significantly enriched TE subfamilies are plotted. (E) TE subfamilies enriched in regions with variable methylation loss. Dots show the observed/expected ratio for each TE subfamily. The expected number of overlaps in shuffled controls was used to calculate the ratio. The color of the dots represents evolutionary age, whereas size represents the number of elements. (F) TF binding motifs enriched within each TE subfamily with variable methylation loss. The color scale is –log10(P-value) of TF motif enrichment.


