
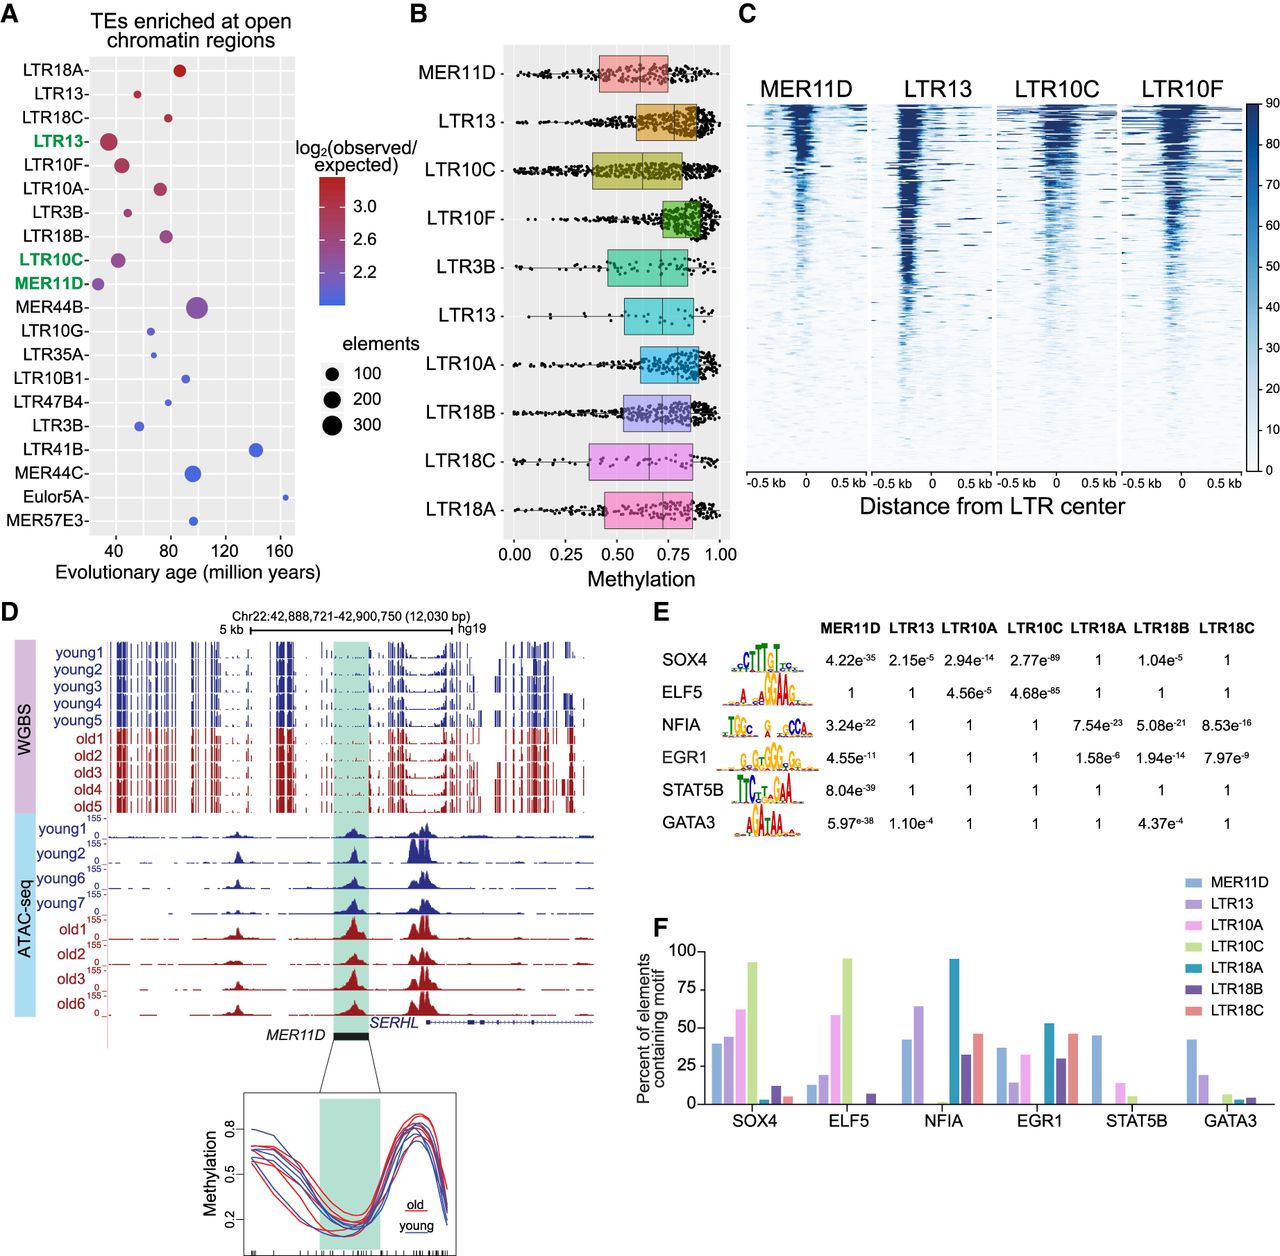
Evolutionarily recent LTR elements have signatures of regulatory elements in mammary luminal epithelial cells (LEps). (A) Top 20 TE subfamilies (mostly LTRs) enriched in open chromatin peaks in young LEps. Evolutionary age is indicated for each subfamily. The size of the dot indicates the number of elements overlapping ATAC-seq peaks, and the color indicates log2 enrichment (observed/expected). (B) Boxplot of DNA methylation levels for each copy of the 10 most evolutionarily recent LTR subfamilies that were enriched among open chromatin regions. (C) ATAC-seq profile across all elements of MER11D, LTR13, LTR10C, and LTR10F subfamilies in young LEps. (D) Genome Browser tracks show a representative example of a hypomethylated (<30% methylation) MER11D element in LEps. The bottom panel shows smoothed line plots of methylation levels at the same element highlighted in green. (E) Transcription factor binding motifs enriched among hypomethylated (<30% methylation) LTR sequences of evolutionarily recent subfamilies. The P-values for enrichment over scrambled sequences are listed. (F) Bar plots show the percentage of hypomethylated TE sequences (<30% methylation) that contain indicated TF binding motifs.


