
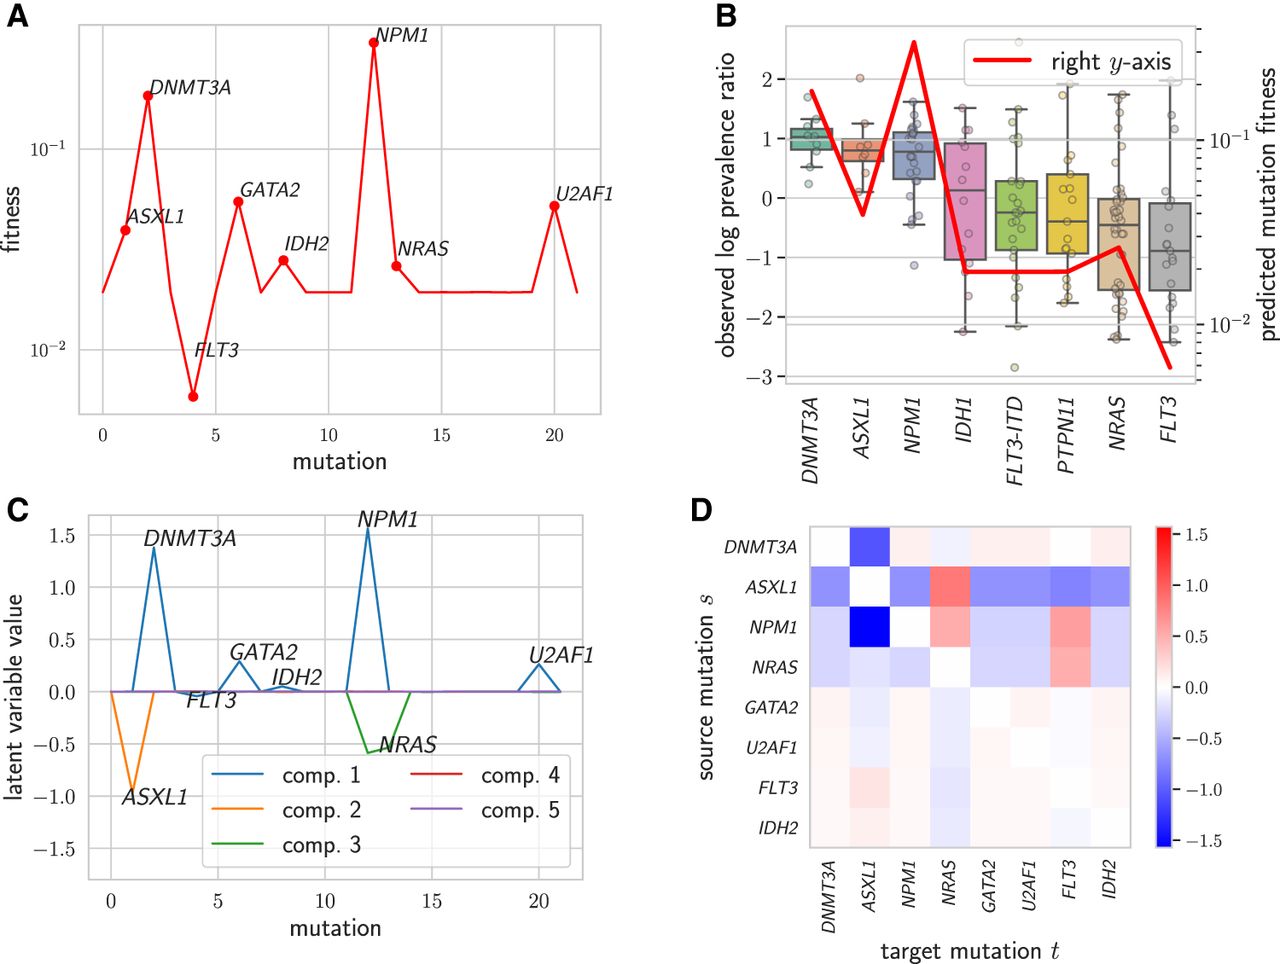
CloMu predicts fitness values validated by clone prevalence measurements and uncovers interchangeability and relative causal relationships on an AML data set (Morita et al. 2020). (A) CloMu identifies seven mutations with far greater fitness values than other mutations and identified one mutation (FLT3) with a substantially lower fitness value. (B) Box plot of log prevalence ratios for the eight mutations with the low standard error in log prevalence ratios (left y-axis), as well as a line showing our predicted mutation fitness values (right y-axis). The results show the validity of our fitness predictions. (C) Latent representations of mutations obtained from the L = 5 hidden neurons. This plot shows that GATA2 and U2AF1 are interchangeable on these data. (D) Relative causal relationships between mutation pairs (s, t). A value greater than zero (red) is indicative of mutation s (row) causing mutation t (column) in the same clone, whereas a value smaller than zero (blue) is indicative of mutation s inhibiting the occurrence of mutation t in the same clone.


