
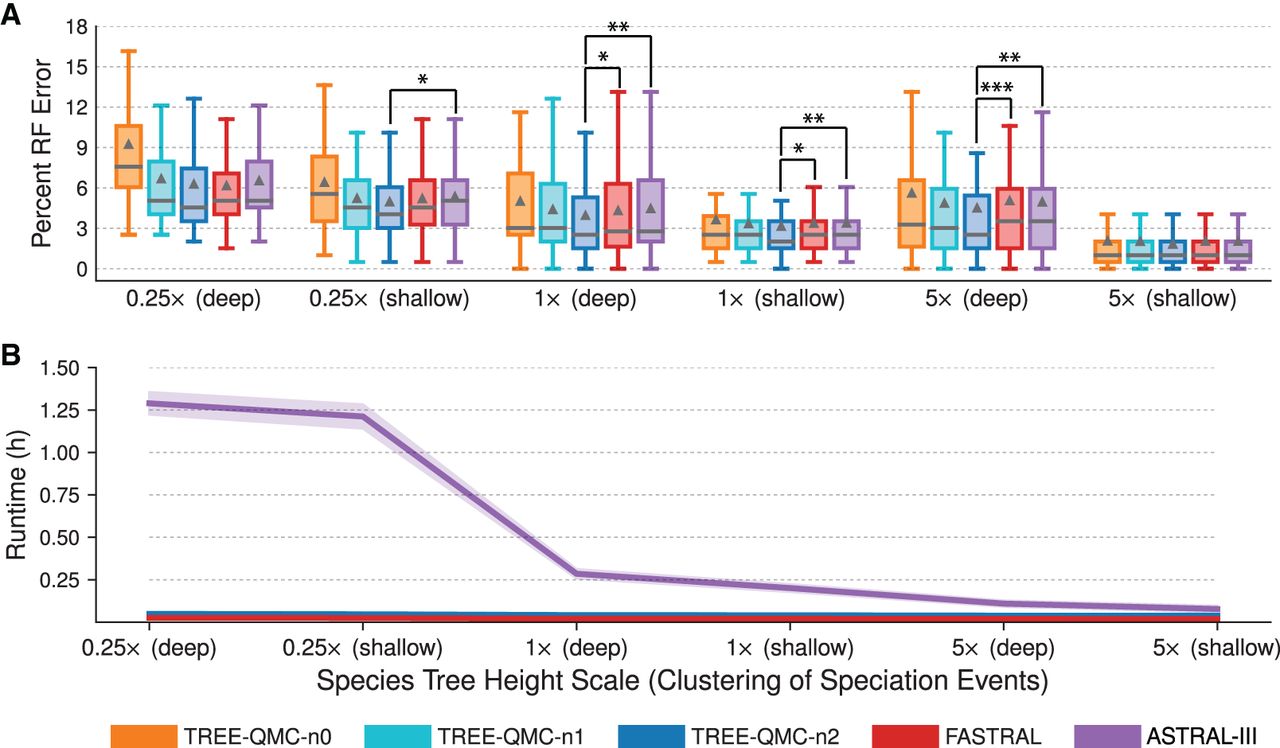
Impact of the amount of ILS. (A) Percent species tree error across replicates (bars represent medians; triangles represent means; outliers are not shown). The symbols *, **, and *** indicate significance at P < 0.05, 0.005, and 0.0005, respectively (three tests survive multiple comparison corrections; see Supplemental Table S5 for details). (B) Mean runtime across replicates (shaded region indicates standard error). All data sets have 200 taxa and 1000 estimated gene trees. One model condition with species tree height 1× and shallow speciation is repeated from Fig. 2. For species tree heights 0.5×, 1×, and 5×, the ILS level is 68%–69%, 34%, and 9%–21%, respectively, and the GTEE level is 44%, 27%–34%, and 21%–28%, respectively.


